Create a chart on the fly with custom dimensions and measures
In Create charts on the fly with analytics/chart,
you built a chart using field names and expression strings in the dimensions and measures
attributes.
That approach is suitable for simple charts:
dimensions='["Region"]'measures='["Sum(Sales)"]'To define custom labels and other dimension or measure properties, pass complete qDef objects
as a single ordered array through the dimensions attribute.
Add dimension definitions first, followed by measure definitions. Do not pass complete measure
objects through the separate measures attribute.
In this tutorial, you’ll render a bar chart with a custom dimension label and a custom measure label.
What you’ll learn
- How to construct a field-based dimension using
qFieldDefsandqFieldLabels. - How to construct a measure using
qLabeland the expressionqDef. - How to combine dimension and measure objects into the ordered array expected by
analytics/chart. - How to pass the array to
<qlik-embed>. - How to inspect an existing chart in Qlik Cloud and reuse its definitions.
- How to replace the field-based dimension with a calculated dimension.
Prerequisites
- A Qlik Cloud tenant.
- A SPA OAuth2 client configured for your web application. For a full walkthrough of authentication options, see the qlik-embed auth overview.
- The app ID of a Qlik Sense app whose data model
contains
RegionandSalesfields, or equivalent fields that you can substitute in the examples. - Basic familiarity with HTML, JavaScript, and JSON.
Replace values in angle brackets (<PLACEHOLDER>) with your own values. Field names such as
Region and Sales are examples: substitute fields that exist in your app.
Step 1: Set up the page
Add the qlik-embed script to the page’s <head>. Replace the placeholder values with your
tenant URL, OAuth client ID, and callback URL.
<script crossorigin="anonymous" type="application/javascript" src="https://cdn.jsdelivr.net/npm/@qlik/embed-web-components@1/dist/index.min.js" data-host="<QLIK_TENANT_URL>" data-client-id="<QLIK_OAUTH2_CLIENT_ID>" data-redirect-uri="<QLIK_CALLBACK_URI>" data-access-token-storage="session"></script>For information about creating the OAuth client and callback page, see the qlik-embed authentication overview.
Add a container and the <qlik-embed> component to the page body:
<div class="chart-container"> <qlik-embed id="chart" ui="analytics/chart" app-id="<QLIK_APP_ID>" type="barchart" ></qlik-embed></div>Add CSS to give the chart a visible height:
<style>  .chart-container {    width: 100%;    height: 500px;  }
  .chart-container qlik-embed {    display: block;    width: 100%;    height: 100%;  }</style>
barchart is the
Viz on the fly ID for a bar chart.
Step 2: Construct the dimension definition
A field-based dimension groups chart data by the values of a field in the app’s data model.
The following definition groups data by Region and displays the label Sales region:
{ "qDef": { "qFieldDefs": ["Region"], "qFieldLabels": ["Sales region"] }}The definition uses the following properties:
qFieldDefscontains the fields or expressions used by the dimension.qFieldLabelscontains labels corresponding to the entries inqFieldDefs.
Use a field name that exists in the selected app’s data model. The Engine API schema defines the object structure, not the fields available in a particular app.
For the complete property definitions, see:
Step 3: Construct the measure definition
A measure calculates a value for each dimension group.
The following measure calculates total sales and displays the label Total sales:
{ "qDef": { "qLabel": "Total sales", "qDef": "Sum(Sales)" }}The measure uses the following properties:
qLabelcontains the display label.- The inner
qDefcontains the Qlik expression to evaluate.
The name qDef appears at two nesting levels:
- The outer
qDefis an object containing the measure definition. - The inner
qDefis the string containing the measure expression.
In this example, measure.qDef is an object and measure.qDef.qDef is the
Sum(Sales) expression.
For the complete property definitions, see:
Step 4: Assemble the fields array
Place the dimension and measure definitions in one ordered array.
Add dimensions first, followed by measures:
const fields = [ { qDef: { qFieldDefs: ["Region"], qFieldLabels: ["Sales region"] } }, { qDef: { qLabel: "Total sales", qDef: "Sum(Sales)" } }];Although the component attribute is named dimensions, the array can contain complete
dimension and measure definitions.
Do not place a complete measure object in the separate measures attribute. The
analytics/chart adapter treats entries in that attribute as expression strings.
Use the measures attribute for simple expressions such as measures='["Sum(Sales)"]'.
When using complete objects, add the measure objects after the dimension objects in the array
passed through dimensions.
Also avoid setting a properties attribute that defines its own qHyperCubeDef on the same
element. It does not cleanly override the dimensions array: properties.qHyperCubeDef.qDimensions
is prepended in front of whatever dimensions defines, so the chart renders both sets of
dimensions concatenated into one hypercube instead of either one you designed.
Step 5: Pass the array to qlik-embed
Serialize the mixed array with JSON.stringify() and assign it to the component’s
dimensions attribute:
<script>  const fields = [    {      qDef: {        qFieldDefs: ["Region"],        qFieldLabels: ["Sales region"]      }    },    {      qDef: {        qLabel: "Total sales",        qDef: "Sum(Sales)"      }    }  ];
  customElements.whenDefined("qlik-embed").then(() => {    const chart = document.getElementById("chart");    chart.setAttribute("dimensions", JSON.stringify(fields));  });</script>
There is no separate measures attribute in this example.
In static HTML, you can serialize the mixed array directly in the dimensions attribute:
<qlik-embed ui="analytics/chart" app-id="<QLIK_APP_ID>" type="barchart" dimensions='[{"qDef":{"qFieldDefs":["Region"],"qFieldLabels":["Sales region"]}},{"qDef":{"qLabel":"Total sales","qDef":"Sum(Sales)"}}]'></qlik-embed>When using the raw web component in a framework template, bind JSON.stringify(fields) to the
dimensions attribute. For example, Vue uses:
<qlik-embed ui="analytics/chart" :app-id="appId" type="barchart" :dimensions="JSON.stringify(fields)"></qlik-embed>The :dimensions binding is Vue-specific syntax. It is not valid in plain HTML.
Step 6: Check the result
Open the page in your browser. After authentication completes, the page renders a bar chart that shows total sales for each region.
You should see:
- one bar for each value in the
Regionfield - Sales region as the dimension label
- Total sales as the measure label
- bar values calculated using
Sum(Sales)
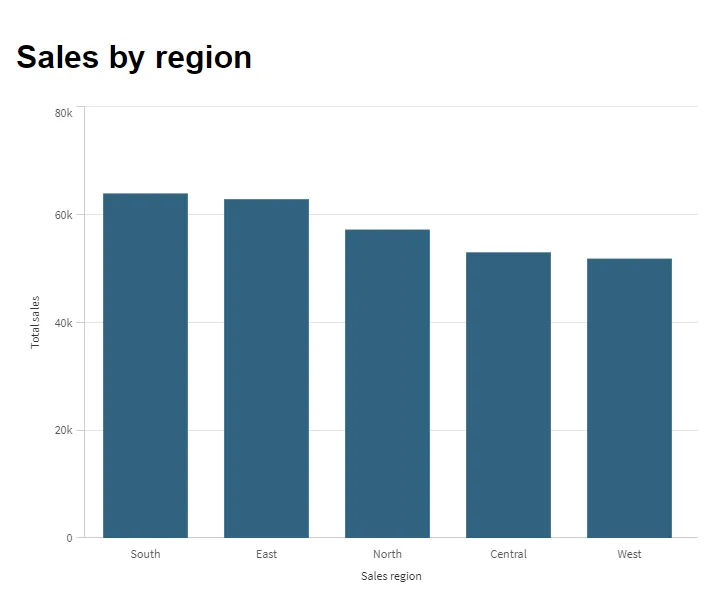
The custom labels confirm that qlik-embed used the complete dimension and measure definitions,
rather than only the underlying Region field and Sum(Sales) expression.
Adapt the example
Use a calculated dimension
The main example uses the Region field as a field-based dimension.
When the grouping value must be derived from an expression, replace the dimension definition at
the beginning of the fields array.
For example, the following definition groups sales by the month of OrderDate:
{ "qDef": { "qFieldDefs": ["=Month(OrderDate)"], "qFieldLabels": ["Order month"] }}The adapted array is:
const fields = [ { qDef: { qFieldDefs: ["=Month(OrderDate)"], qFieldLabels: ["Order month"] } }, { qDef: { qLabel: "Total sales", qDef: "Sum(Sales)" } }];A calculated dimension expression belongs in qFieldDefs. A measure expression belongs in the
measure’s inner qDef.
Reuse definitions from an existing chart
If you already have a chart configured in Qlik Cloud, you can use its properties as a starting point.
- In a Qlik Sense app, create or open a chart and configure its dimensions, measures, and labels.
- Add
/options/developerto the end of the sheet URL. For the full workflow, see Find the chart ID in developer mode. - Open the chart’s ellipses menu and select Developer.
- In the Developer dialog, expand Properties.
- Locate
qHyperCubeDef.qDimensionsandqHyperCubeDef.qMeasures. - Copy the required dimension definitions into the beginning of your
fieldsarray. - Copy the required measure definitions after the dimensions.
- Remove properties that are not needed by your embedded chart.
The Developer dialog displays the chart’s full properties object, with qHyperCubeDef
nested inside it. Do not copy qHyperCubeDef as a whole into a properties attribute on the
<qlik-embed> element. Extract only the individual entries from qDimensions and qMeasures
into the fields array passed through dimensions, as shown in this tutorial.
The resulting array should follow this order:
const fields = [ dimensionDefinition, measureDefinition, additionalMeasureDefinition];Troubleshooting
The browser console reports that startsWith is not a function
startsWith is not a functionA complete measure object was probably passed through the separate measures attribute.
This fails:
measures='[{"qDef":{"qLabel":"Total sales","qDef":"Sum(Sales)"}}]'Add the complete measure object to the mixed array passed through dimensions instead.
The chart does not render
Verify that:
- the mixed array is serialized with
JSON.stringify()before assigning it to the raw web component - the serialized
dimensionsvalue contains valid JSON - dimension objects appear before measure objects
- the field names exist in the selected app
- measure and calculated-dimension expressions use valid Qlik syntax
- the app ID points to the app containing the fields
- no
propertiesattribute with its ownqHyperCubeDefis set on the same element: this concatenates withdimensionsandmeasuresinstead of replacing them, and the resulting extra dimension can make the chart render something unexpected instead of failing outright
If a calculated dimension or measure expression is the suspected cause, isolate the problem by
building the expression up in stages. For example, replace the expression with ="hello", confirm
the chart renders, then try =[FieldName], then add the full expression back one piece at a time
until it breaks. This narrows down exactly where the syntax is invalid.
Custom labels are not applied
Verify that:
- dimension properties are inside the dimension’s
qDef - the measure label and expression are inside the measure’s
qDef - the measure expression is assigned to the inner
qDef
Migrate from visualization.create()
The Capability API columns argument and the array used in this tutorial follow the same
general ordering: dimensions first, followed by measures.
For example, a visualization.create() call such as:
app.visualization.create("barchart", [ dimensionDefinition, measureDefinition]);maps to:
const fields = [  dimensionDefinition,  measureDefinition];
chart.setAttribute("dimensions", JSON.stringify(fields));
With qlik-embed, supply the app through app-id and the visualization type through type.
The component renders declaratively while it remains in the page. There is no direct equivalent
to the Capability API’s .show() and .close() methods.
This is not necessarily a one-to-one migration. Review visualization-specific options.
Next steps
- Review the simpler charts-on-the-fly tutorial to create charts using field-name and expression strings.
- Explore the supported visualization types.
- Explore the available qlik-embed UIs and parameters.
Full code
Full HTML code for the chart
<!DOCTYPE html><html lang="en">  <head>    <meta charset="utf-8" />    <meta name="viewport" content="width=device-width, initial-scale=1" />    <title>Sales by region</title>
    <script      crossorigin="anonymous"      type="application/javascript"      src="https://cdn.jsdelivr.net/npm/@qlik/embed-web-components@1/dist/index.min.js"      data-host="<QLIK_TENANT_URL>"      data-client-id="<QLIK_OAUTH2_CLIENT_ID>"      data-redirect-uri="<QLIK_CALLBACK_URI>"      data-access-token-storage="session"    ></script>
    <style>      .chart-container {        width: 100%;        height: 500px;      }
      .chart-container qlik-embed {        display: block;        width: 100%;        height: 100%;      }    </style>  </head>
  <body>    <div class="chart-container">      <qlik-embed        id="chart"        ui="analytics/chart"        app-id="<QLIK_APP_ID>"        type="barchart"      ></qlik-embed>    </div>
    <script>      const fields = [        {          qDef: {            qFieldDefs: ["Region"],            qFieldLabels: ["Sales region"]          }        },        {          qDef: {            qLabel: "Total sales",            qDef: "Sum(Sales)"          }        }      ];
      customElements.whenDefined("qlik-embed").then(() => {        const chart = document.getElementById("chart");        chart.setAttribute("dimensions", JSON.stringify(fields));      });    </script>  </body></html>