Embed single objects using iframes and the Single Integration API
For new integrations, use qlik-embed to safeguard against third-party cookie blocking and unlock future features.
This tutorial remains available for those with existing implementations, but upgrading to qlik-embed ensures a robust, forward-looking solution.
To do something similar with qlik-embed, refer
to embedding Qlik Analytics using qlik-embed web components
and leverage the classic/app or classic/chart UIs.
You can integrate single Qlik Sense visualizations, sheets, or snapshots into an iframe. You use the Single Integration API to define how the object should be integrated into your web site, using the Embed dialogs in the Qlik Sense interface.
The Single configurator is a Qlik Sense tool that provides an easy way of creating simple mashup pages without having to write any code at all. It returns a Qlik Sense object, which is identified in an URL. The Qlik Sense object is typically a visualization from an app, for example a Line chart.
The Single configurator generates a URL that returns a complete HTML page with a generic embedded visualization.
You can embed this URL in your own web page using an <iframe>, for example.
For more information, see the Single Integration API reference.
Single integration examples
These examples leverage the Executive Dashboard demo app, available on qlik-oss. You should modify the URL and appId in the snippets below to match your tenant and app.
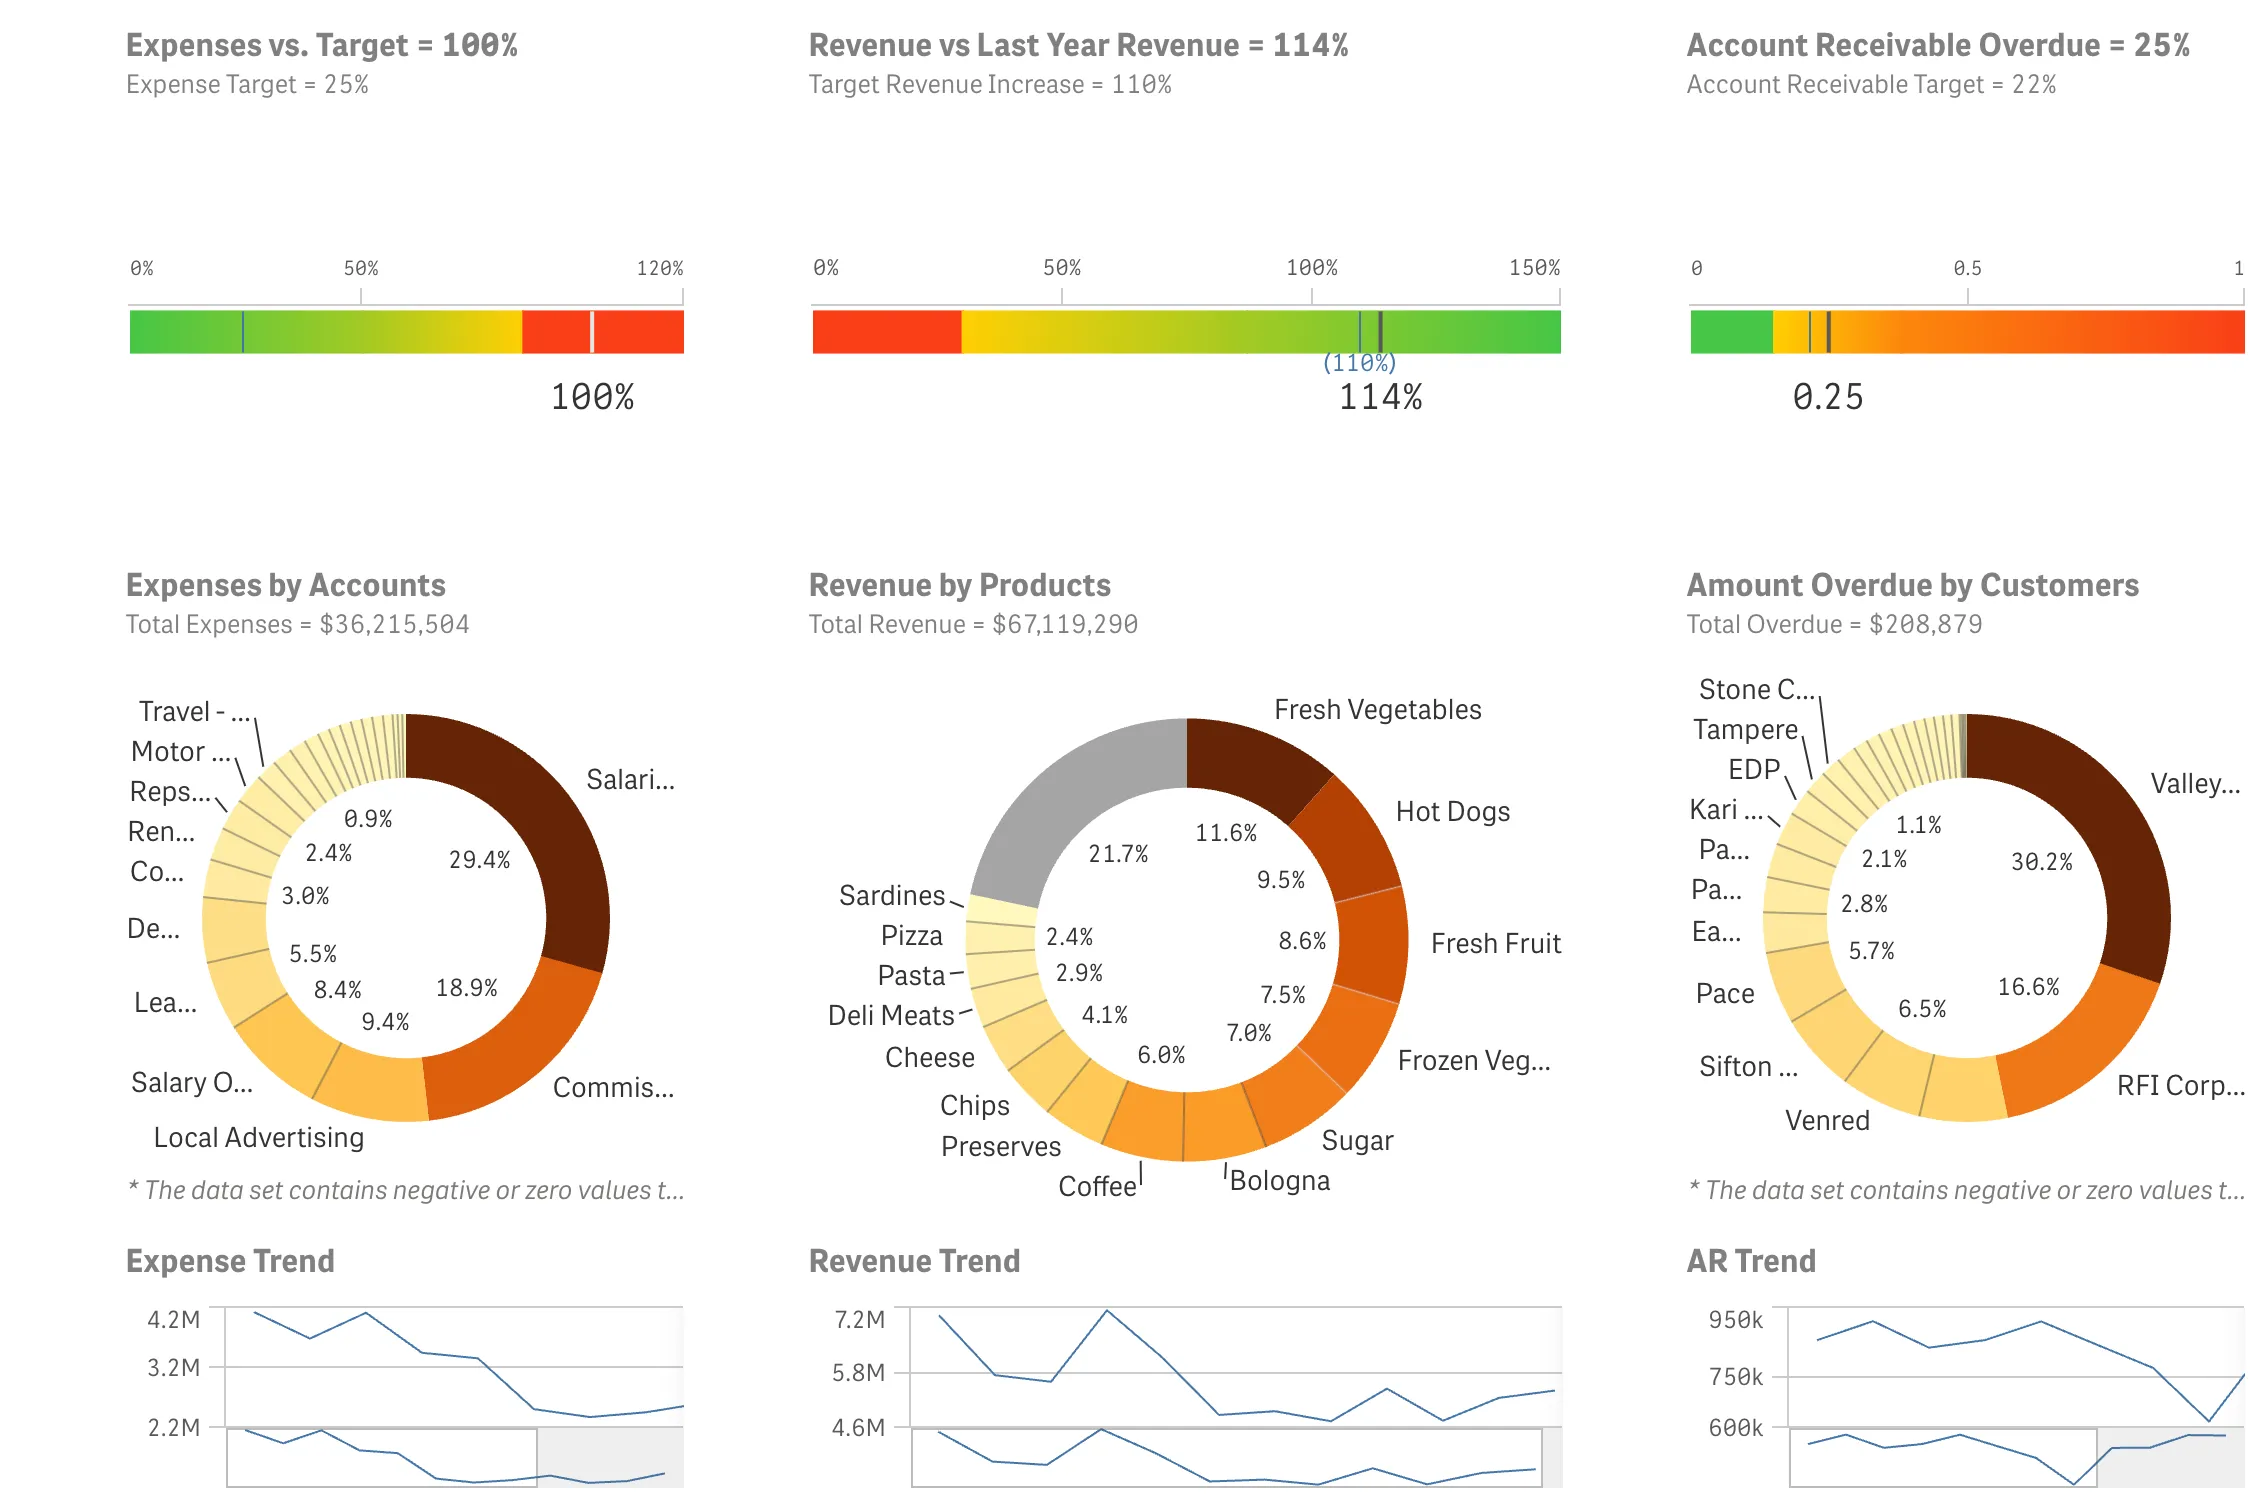
Integrating a sheet into an iframe
This example shows how to call the KPI Dashboard sheet, with object ID PfKsJK.
Example:
<iframe src="https://tenant.region.qlikcloud.com/single/?appid=76daa5f7-c3b3-40a7-a8a1-8c1453b2acf6&sheet=PfKsJK"frameborder="0"></iframe>This renders as:
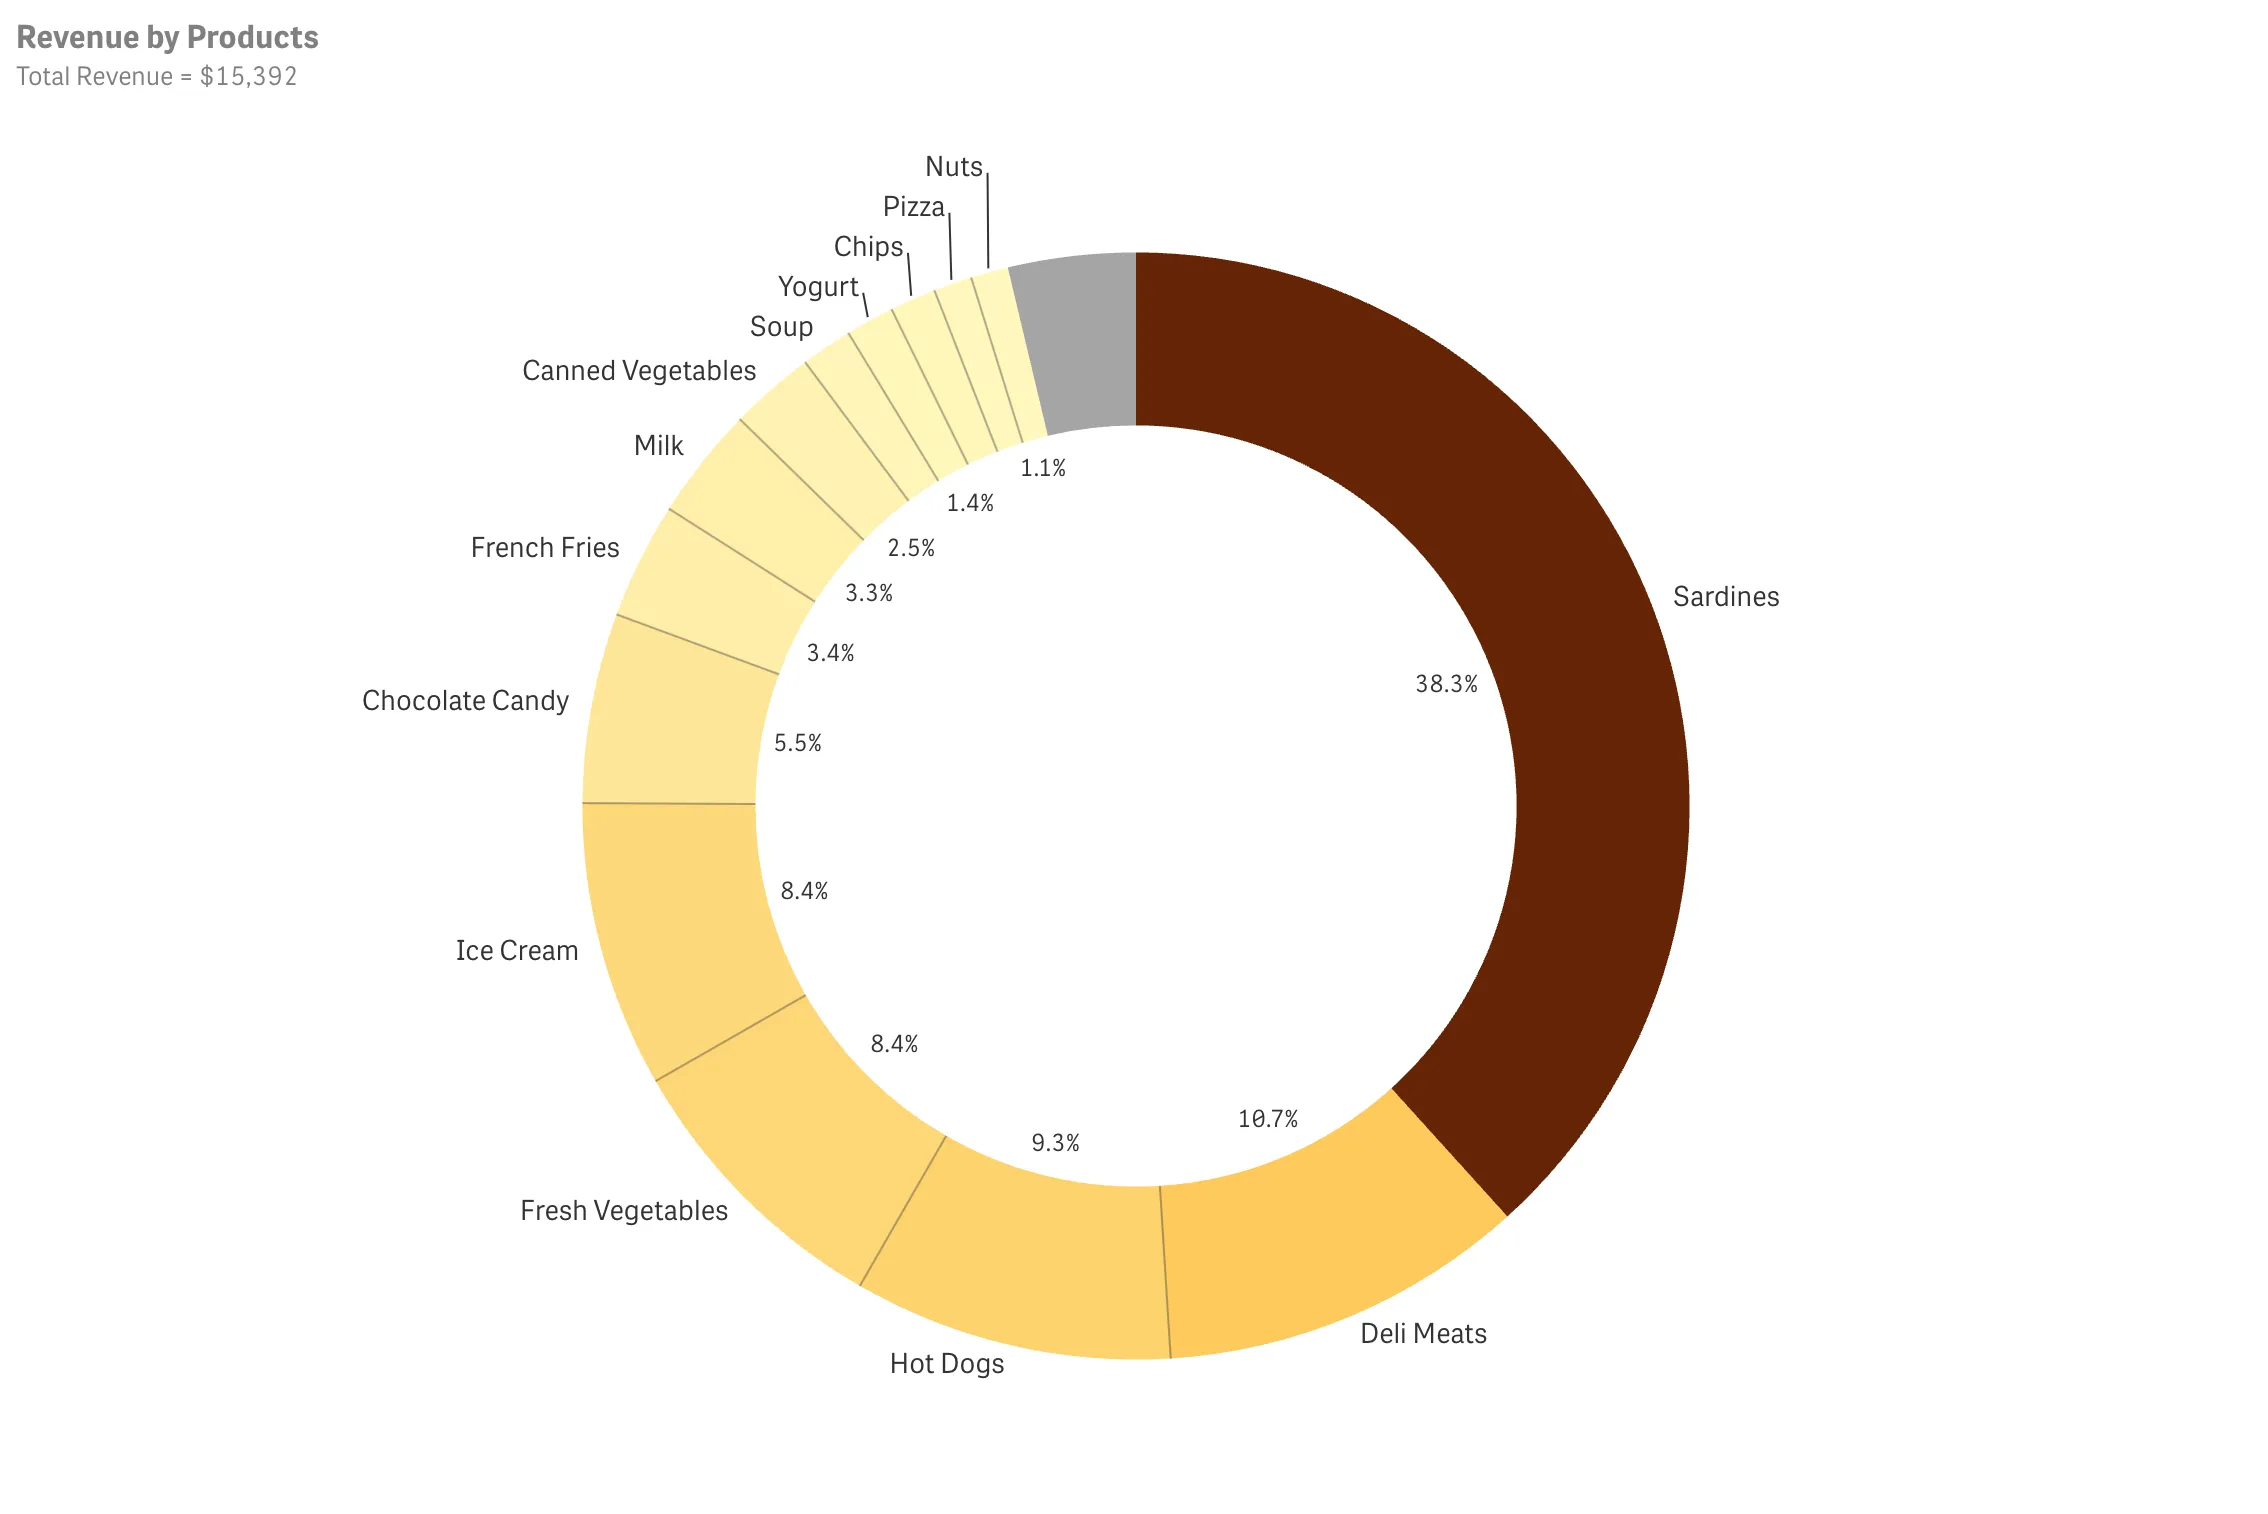
Integrating a visualization into an iframe
This example shows how to call the Revenue by Products pie chart, with object ID
ZxDKp.
Example:
<iframe src="https://tenant.region.qlikcloud.com/single/?appid=76daa5f7-c3b3-40a7-a8a1-8c1453b2acf6&obj=ZxDKp"frameborder="0"></iframe>This renders as:
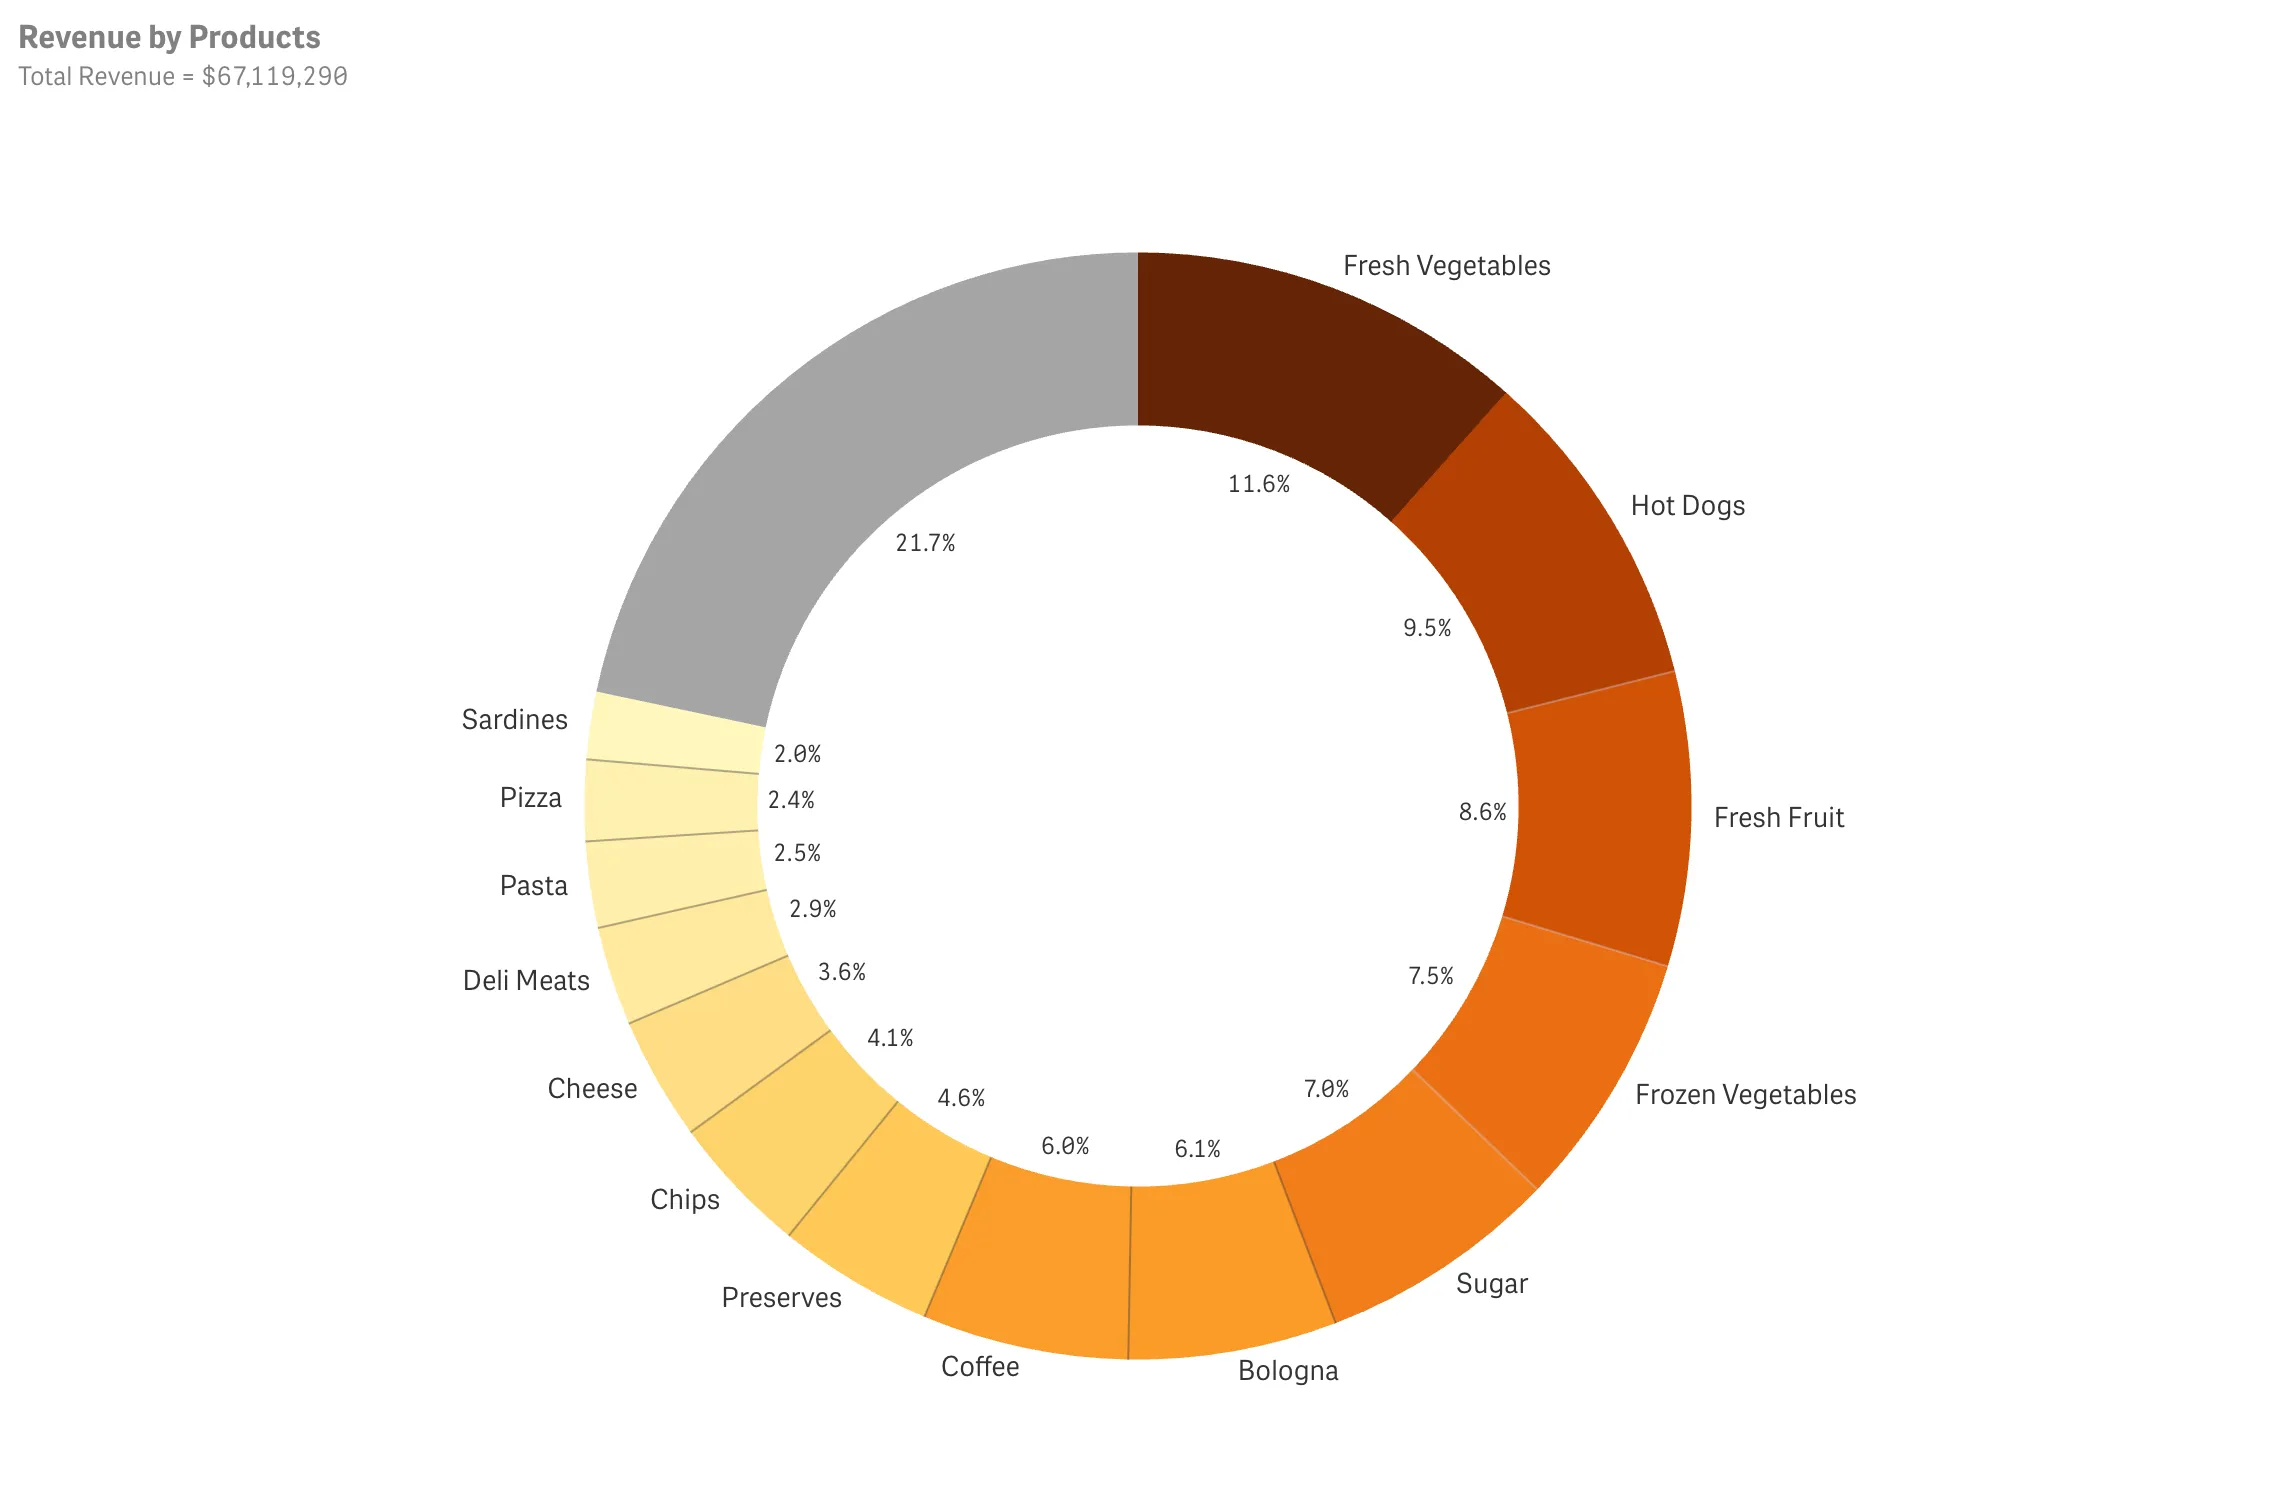
Defining single preselected value
This example shows how to call the Revenue by Products pie chart, with object ID
ZxDKp with the selection: Customer = Venred.
Example:
<iframe src="https://tenant.region.qlikcloud.com/single/?appid=76daa5f7-c3b3-40a7-a8a1-8c1453b2acf6&obj=ZxDKp&select=Customer,Venred"frameborder="0"></iframe>This renders as:
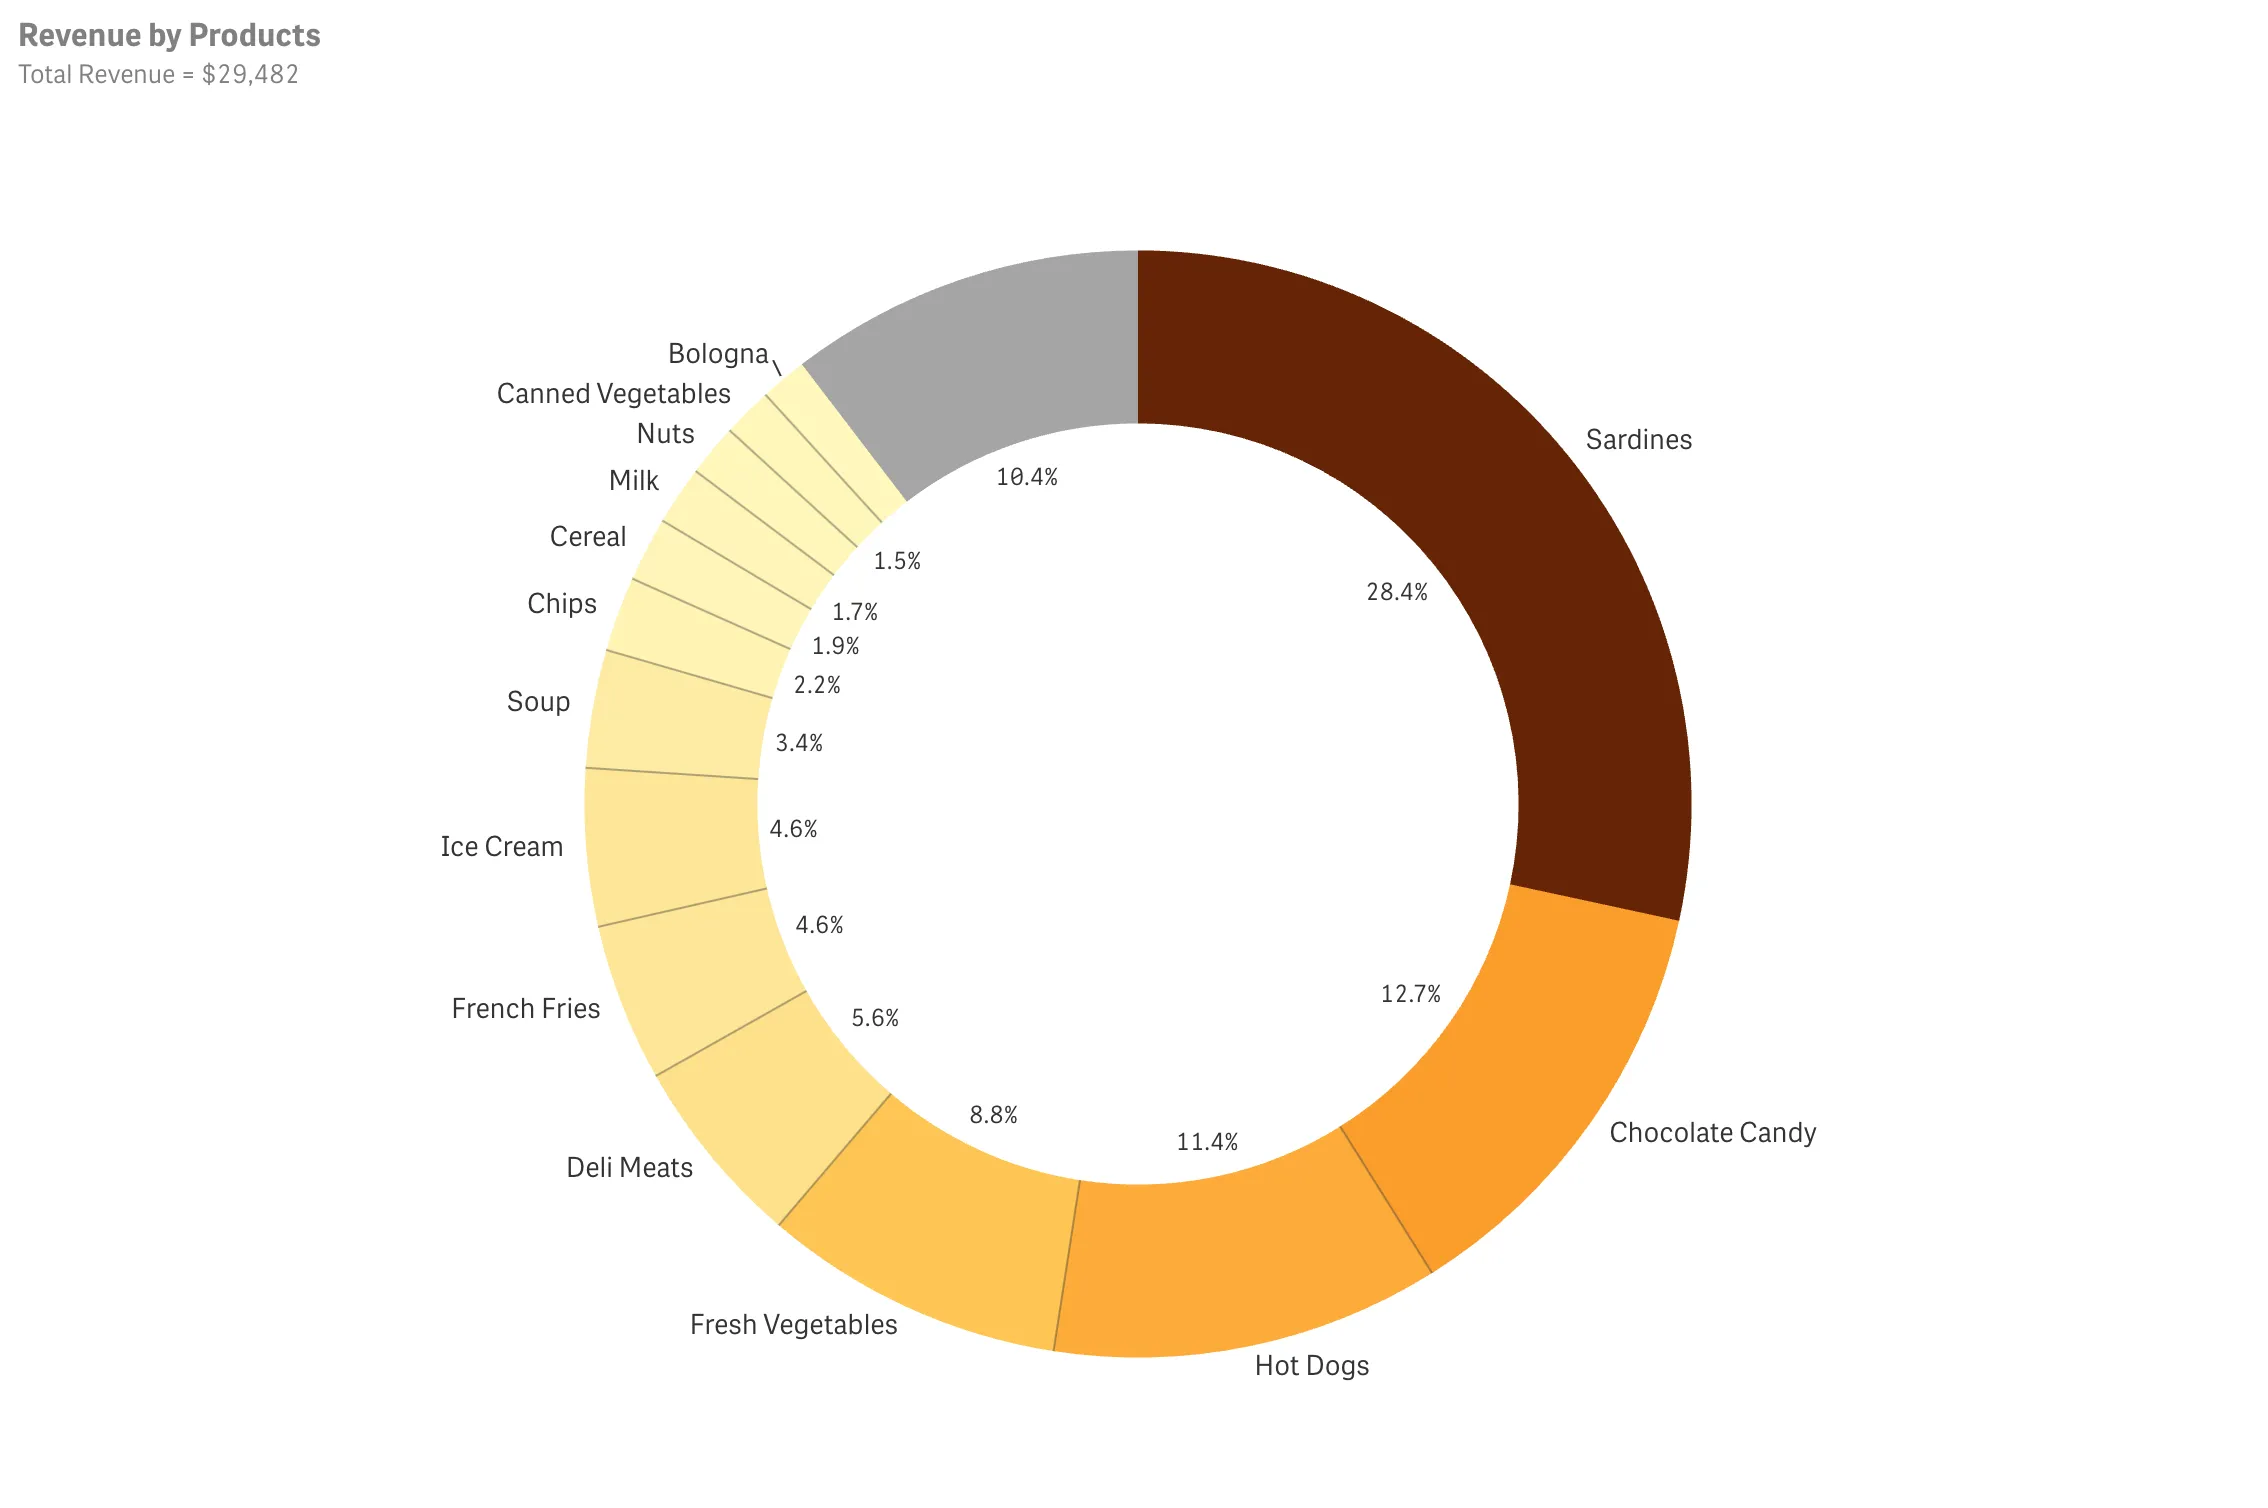
Defining multiple preselected values
This example shows how to call the Revenue by Products pie chart, with object ID
ZxDKp with the selections: Customer = Venred and FiscalMonth = 1,2,3.
Example:
<iframe src="https://tenant.region.qlikcloud.com/single/?appid=76daa5f7-c3b3-40a7-a8a1-8c1453b2acf6&obj=ZxDKp&select=Customer,Venred&select=FiscalMonth,1,2,3"frameborder="0">This renders as: