Create charts on the fly with analytics/chart
In this tutorial, you’ll build a web page that embeds a Qlik Sense chart and lets users change the visualization type, dimension, and measure at runtime without saving the object to the app. You’ll learn how to configure the qlik-embed component and wire up dropdown controls to trigger dynamic updates.
This pattern is known as charts on the fly: the chart is defined entirely
in the <qlik-embed> tag and exists only for the current browser session.
Prerequisites
- A Qlik Cloud tenant (not Qlik Sense Business).
- A SPA OAuth2 client configured for your web application.
- An app ID for a Qlik Sense app that contains the fields and measure expressions you want
to visualize. A saved chart object is not required because the chart is created on the fly
from the
<qlik-embed>definition. However, your app must have a data model with fields and expressions matching the dropdown examples (or you must substitute your own). - Basic familiarity with HTML and JavaScript.
Variable substitution
The sample code uses these placeholder variables. Replace each one with the actual value for your environment.
| Variable | Description |
|---|---|
<QLIK_TENANT_URL> | Your Qlik Cloud tenant URL, for example tenant.us.qlikcloud.com. |
<QLIK_OAUTH2_CLIENT_ID> | The client ID for your SPA OAuth2 client entry. |
<QLIK_CALLBACK_URI> | The redirect URL registered in your OAuth2 client configuration. |
<QLIK_APP_ID> | The unique identifier of the Qlik Sense app to use. |
Placeholder conventions: Replace values in angle brackets (<PLACEHOLDER>) with
your actual credentials or values. Do not replace square bracket field names like
[Region] — these refer to fields in your Qlik app and are part of the Qlik script
syntax.
Set up the page
Create an HTML file and add the qlik-embed script tag to the <head>. This
script loads the web components and handles authentication against your tenant.
<head> <meta charset="utf-8"> <script crossorigin="anonymous" type="application/javascript" src="https://cdn.jsdelivr.net/npm/@qlik/embed-web-components@1/dist/index.min.js" data-host="<QLIK_TENANT_URL>" data-client-id="<QLIK_OAUTH2_CLIENT_ID>" data-redirect-uri="<QLIK_CALLBACK_URI>" data-access-token-storage="session" ></script></head>The <meta charset="utf-8"> tag is recommended. Certain chart types, including KPI,
do not render correctly without it. See the
UTF-8 character encoding requirement
for details.
Add a chart on the fly
In the <body>, add a <qlik-embed> element configured for analytics/chart wrapped in a
container with explicit height. Instead of providing an object-id that references a saved
visualization, set type, dimensions, and measures on the element.
<div class="chart-container">  <qlik-embed    id="chart"    ui="analytics/chart"    app-id="<QLIK_APP_ID>"  ></qlik-embed></div>
<script>  const chart = document.getElementById("chart");  chart.setAttribute("type", "barchart");  chart.setAttribute("dimensions", JSON.stringify(["[Region]"]));  chart.setAttribute("measures", JSON.stringify(["=Sum(Sales)"]));</script>
Add corresponding CSS to ensure the chart container has explicit dimensions:
.chart-container {  width: 100%;  height: 400px;  min-height: 400px;}
.chart-container qlik-embed { width: 100%; height: 100%;}type: The Viz on the fly ID for the chart you want to render. See the visualization support table for all available IDs. Only chart types that supportanalytics/chartcan be used here.dimensions: A JSON array of field names. Wrap each name in square brackets for Qlik script compatibility:["[FieldName]"].measures: A JSON array of expressions, each prefixed with=:["=Sum(Sales)"].- Using JavaScript with
JSON.stringify()handles character escaping automatically, making it easier to work with complex Qlik script expressions.
When using inline dimensions and measures, the rendered chart may display the field
or expression definition as the chart label. For example, the x-axis may show
[Region] and the y-axis may show =Sum(Sales). This is expected for this basic
on-the-fly definition.
Add interactive controls
Add a control panel preceding the chart that lets the user pick a chart type,
dimension, and measure. JavaScript reads the selected values and updates the
<qlik-embed> tag’s attributes, triggering the component to re-render with the
new definition.
Add the control panel HTML
<div class="controls">  <label>    Chart type    <select id="chart-type">      <option value="barchart">Bar chart</option>      <option value="linechart">Line chart</option>      <option value="piechart">Pie chart</option>    </select>  </label>
  <label>    Dimension    <select id="dimension">      <option value="[Region]">Region</option>      <option value="[CategoryName]">Category</option>      <option value="[ProductName]">Product</option>    </select>  </label>
  <label>    Measure    <select id="measure">      <option value="=Sum(Sales)">Sales</option>      <option value="=Sum([Cost of Goods Sold])">Cost of goods sold</option>      <option value="=Avg(Sales)">Average sales</option>    </select>  </label></div>
Replace the field names and expressions in the <option> values with those that
exist in your app.
Wire up the update logic
Add a <script> block at the bottom of the <body>. When any dropdown changes,
the function reads the current selections and sets the corresponding attributes on
the <qlik-embed> element.
<script>  function updateChart() {    const chart = document.getElementById("chart");    const type = document.getElementById("chart-type").value;    const dimension = document.getElementById("dimension").value;    const measure = document.getElementById("measure").value;
    chart.setAttribute("type", type);    chart.setAttribute("dimensions", JSON.stringify([dimension]));    chart.setAttribute("measures", JSON.stringify([measure]));  }
  document    .getElementById("chart-type")    .addEventListener("change", updateChart);  document    .getElementById("dimension")    .addEventListener("change", updateChart);  document    .getElementById("measure")    .addEventListener("change", updateChart);</script>
Result
When you open the page, click Authorize to authenticate with your Qlik tenant.
The chart renders as a bar chart using the default definition:
- Chart type: Bar chart
- Dimension: Region
- Measure: Sales
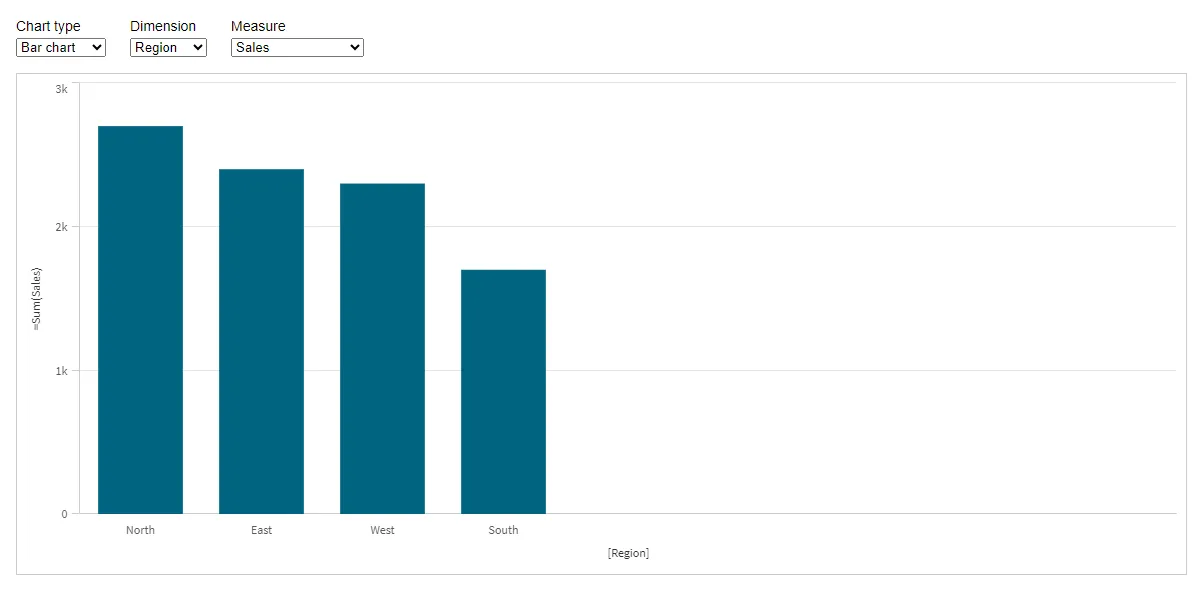
The chart displays sales totals grouped by region.
When you change any of the dropdown selections, the chart updates to reflect the new definition. For example, switching the chart type to line chart renders the same data as a line chart.
If the chart does not render after a selection change, verify that both the selected field and any fields referenced in the expression exist in your app’s data model.
Important considerations
Using master library items
Charts on the fly define dimensions and measures inline, which has implications for how master library items work.
Master dimensions can be referenced by their title using bracket notation, the
same as a native field: ["[My Master Dimension]"]. The engine resolves the title
to the matching library item at query time.
Master measures cannot be referenced by name in the measures attribute. You
must write the aggregation expression inline, for example "=Sum(Sales)". If the
expression you want to use is already defined in the app as a master measure, copy
its expression text and paste it directly into your measures value.
Choosing compatible chart types
Only chart types that support analytics/chart (nebula.js objects) can be used
for charts on the fly. Charts that require classic/chart or are marked as not
supported for analytics/chart in the
visualization support table
do not render in this mode.
Not all chart types use the same number of dimensions and measures. This tutorial includes bar chart, line chart, and pie chart because they all work with a single dimension and single measure. For example, scatter plot requires one dimension and at least two measures (one for each axis), so it is not included in this basic example.
How session objects work
A chart on the fly is a session object. It is not saved to the app. If the session ends or the user navigates away, the generated chart object is discarded. When the page loads again, the JavaScript creates a new chart from the inline definition.
Next steps
- Learn about all supported visualization types
and which ones work with
analytics/chart. - For custom labels and calculated dimensions, see Create a chart on the fly with custom dimensions and measures.
- Explore other qlik-embed patterns and use cases to build advanced embedding scenarios.
Full code
Full HTML code for the charts on the fly example
<!DOCTYPE html><html lang="en">  <head>    <meta charset="utf-8" />    <title>Chart on the fly</title>    <script      crossorigin="anonymous"      type="application/javascript"      src="https://cdn.jsdelivr.net/npm/@qlik/embed-web-components@1/dist/index.min.js"      data-host="<QLIK_TENANT_URL>"      data-client-id="<QLIK_OAUTH2_CLIENT_ID>"      data-redirect-uri="<QLIK_CALLBACK_URI>"      data-access-token-storage="session"    ></script>    <style>      body {        font-family: sans-serif;        padding: 1rem;      }      .controls {        display: flex;        gap: 1.5rem;        margin-bottom: 1rem;        flex-wrap: wrap;      }      .controls label {        display: flex;        flex-direction: column;        gap: 0.25rem;        font-size: 0.875rem;      }      .chart-container {        width: 100%;        height: 400px;        min-height: 400px;      }      .chart-container qlik-embed {        width: 100%;        height: 100%;      }    </style>  </head>  <body>    <div class="controls">      <label>        Chart type        <select id="chart-type">          <option value="barchart">Bar chart</option>          <option value="linechart">Line chart</option>          <option value="piechart">Pie chart</option>        </select>      </label>
      <label>        Dimension        <select id="dimension">          <option value="[Region]">Region</option>          <option value="[CategoryName]">Category</option>          <option value="[ProductName]">Product</option>        </select>      </label>
      <label>        Measure        <select id="measure">          <option value="=Sum(Sales)">Sales</option>          <option value="=Sum([Cost of Goods Sold])">Cost of goods sold</option>          <option value="=Avg(Sales)">Average sales</option>        </select>      </label>    </div>
    <div class="chart-container">      <qlik-embed        id="chart"        ui="analytics/chart"        app-id="<QLIK_APP_ID>"      ></qlik-embed>    </div>
    <script>      const chart = document.getElementById("chart");
      function updateChart() {        const type = document.getElementById("chart-type").value;        const dimension = document.getElementById("dimension").value;        const measure = document.getElementById("measure").value;
        chart.setAttribute("type", type);        chart.setAttribute("dimensions", JSON.stringify([dimension]));        chart.setAttribute("measures", JSON.stringify([measure]));      }
      // Set initial chart properties      chart.setAttribute("type", "barchart");      chart.setAttribute("dimensions", JSON.stringify(["[Region]"]));      chart.setAttribute("measures", JSON.stringify(["=Sum(Sales)"]));
      // Update chart when dropdown selections change      document        .getElementById("chart-type")        .addEventListener("change", updateChart);      document        .getElementById("dimension")        .addEventListener("change", updateChart);      document        .getElementById("measure")        .addEventListener("change", updateChart);    </script>  </body></html>