Dimensions
Where possible, use qlik-embed and qlik-api rather than this framework.
Dimensions are created from fields in the data model tables and they determine how the data in a visualization is grouped - for example total sales per country or number of products per supplier. You typically find a dimension as the slices in a pie chart or on the x-axis of a bar chart with vertical bars.
In some situations, a predefined hierarchy can help you to display data more efficiently. In Qlik Sense, you can achieve this by defining hierarchic groups of fields as drill-down dimensions. Any fields or calculated dimensions can be grouped together. See Defining drill-down dimensions for more details.
Overview
There are three different ways of specifying dimensions in the columns definition:
- As a string
- As a
NxDimensionstructure - As a reference to a predefined dimension, a so-called master dimension
The order of the columns are not always important. For a basic bar chart with one dimension and one measure, the columns can be specified in any order. However, for a table it matters which order the columns are specified, since the order specified in the cols parameter is the order shown in the table.
Defining dimensions using string syntax
Using the string syntax is the easiest way of defining dimensions. But there are some limitations and if you want create more advanced dimensions, you should use the object syntax instead.
[ "NetScoreName", "=Count(NetScoreName)"]One dimension (NetScoreName) and one measure (=Count(NetScoreName))
Defining dimensions using the object syntax
Use the object syntax if you want to set more options for your dimensions, for example, if you want to set labels or limit the data-set to only display the top five values.
{ /*NxDimension structure*/ "qNullSuppression": true, "qDef": { /*NxInlineDimension structure*/ "qFieldDefs": ["NetScoreName"], "qFieldLabels": ["Net result"] }}The NxDimension structure
When defining dimensions using the object syntax you define it as a NxDimension
structure. Most settings are however done inside "qDef", which is a
NxInlineDimensionDef structure.
For full details, see Qlik Sense Engine API: NxDimension.
-
qLibraryId: Refers to a dimension stored in the library.
-
qDef: The definition of the dimension. For full details, see Qlik Sense Engine API: NxInlineDimensionDef.
-
qNullSuppression: If set to true, no null values are returned.
-
qOtherTotalSpec: Sets the dimension limits. Each dimension of a hypercube is configured separately. Defines if some values (grouped as Others) should be grouped together in the visualization.
-
qShowAll: If set to true, all dimension values are shown.
-
qOtherLabel: This property is used when dimension limits have been set in
qOtherTotalSpec. Defines the label of the Others group. The default label isOthers. -
qTotalLabel: This property is used when total mode have been set in
qOtherTotalSpec. Defines the label of theTotalsgroup. -
qCalcCond: Specifies a calculation condition, which must be fulfilled for the dimension to be calculated. If the calculation condition is not met, the dimension is excluded from the calculation.
-
qAttributeExpressions: List of attribute expressions.
-
qAttributeDimensions: List of attribute dimensions.
Referencing predefined dimensions
You can use dimensions that are predefined in the app. You must know the
Dimension ID, which is defined in the qLibraryID property. You must also state
that it is a dimension in the qType property.
{ "qLibraryId":"eqZjE", "qType":"dimension"}Defining drill-down dimensions
When several fields form a natural hierarchy, it can make sense to create a drill-down group. Any fields or calculated dimensions can be grouped together.
Example
Continent, Country, State, City
When you use a drill-down group as a dimension in a chart, the chart uses the first field in the group’s list of fields that has more than one possible value
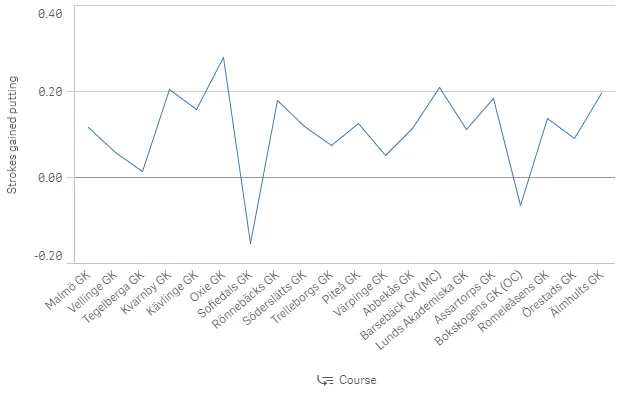
In this example, you’ll group two fields: Course and HoID.
Set "qGrouping": "H" to define drill-down grouping. Since it is a grouped
dimension, more than one field name is defined:
"qFieldDefs": [ "Course", "HoID" ].
[ { "qDef": { "qGrouping": "H", "qFieldDefs": [ "Course", "HoID" ], } }, { "qDef": { "qLabel": "Strokes gained putting", "qDef": "Avg(ExpPutts-Putts)", "qNumFormat": { "qType": "F", "qnDec": 2, "qUseThou": 0, "qFmt": "#,##0.00", "qDec": ".", "qThou": "," }, "autoSort": true } }]Result
