UIs and parameters
Introduction
The qlik-embed framework provides various UIs and configurations, which
are leveraged in your web app with the <qlik-embed ...> HTML tag.
When building your web app, you must first load the relevant script header, and configure any authentication to be used by the objects you’ll add to the page. If you dynamically build the page, ensure this script is loaded before any qlik-embed tags are populated.
Once you’ve got the script tag, you can add one or many <qlik-embed> tags into
your document to leverage components from Qlik, plus helper tags such as
<qlik-initial-selections>.
Component compatibility
This page provides examples for qlik-embed web components, the framework-independent version of qlik-embed. Qlik also publishes libraries for React and Svelte.
Some visualization objects may have specific character encoding or embedding limitations depending on the UI type used. Review the visualization overview if you run into issues.
For Qlik Sense Enterprise client-managed, qlik-embed is supported from the May 2024 release onwards, with the following limitations:
- The use of custom theme overrides is not supported.
- New features announced in the changelog may not be supported until the next major release following the announcement.
UI types
Each UI type provides a different experience in qlik-embed, and all provide the standard Qlik selection and filtering experience by default.
| UI Name | Purpose |
|---|---|
analytics/sheet | Lightweight component designed to bring just the analytics on a sheet, without any other features. |
analytics/chart | Lightweight component designed to bring a single chart object, or create on-the-fly charts, without any other features. |
analytics/field | Lightweight list-box for displaying values from a single field. |
analytics/selections | Lightweight selection bar containing selection controls and values for the referenced Qlik Sense app. |
analytics/snapshot | Renders a static, offline snapshot of a Qlik chart using user-provided JSON data. Only works with noauth mode; does not connect to Qlik Cloud. |
insights/feed-cards | Renders a scrollable list of insight feed cards for the signed-in user, with optional filtering by app. |
classic/app | A full-featured component bringing the Qlik Sense sheet analysis and authoring experience into your web app, supporting most native features. |
classic/chart | Backwards-compatible component designed to bring single chart objects into your app. Supports extensions. |
ai/agentic-assistant | The embedded version of the agentic Qlik Answers assistant. |
ai/assistant | The embedded version of the legacy Qlik Answers assistant. |
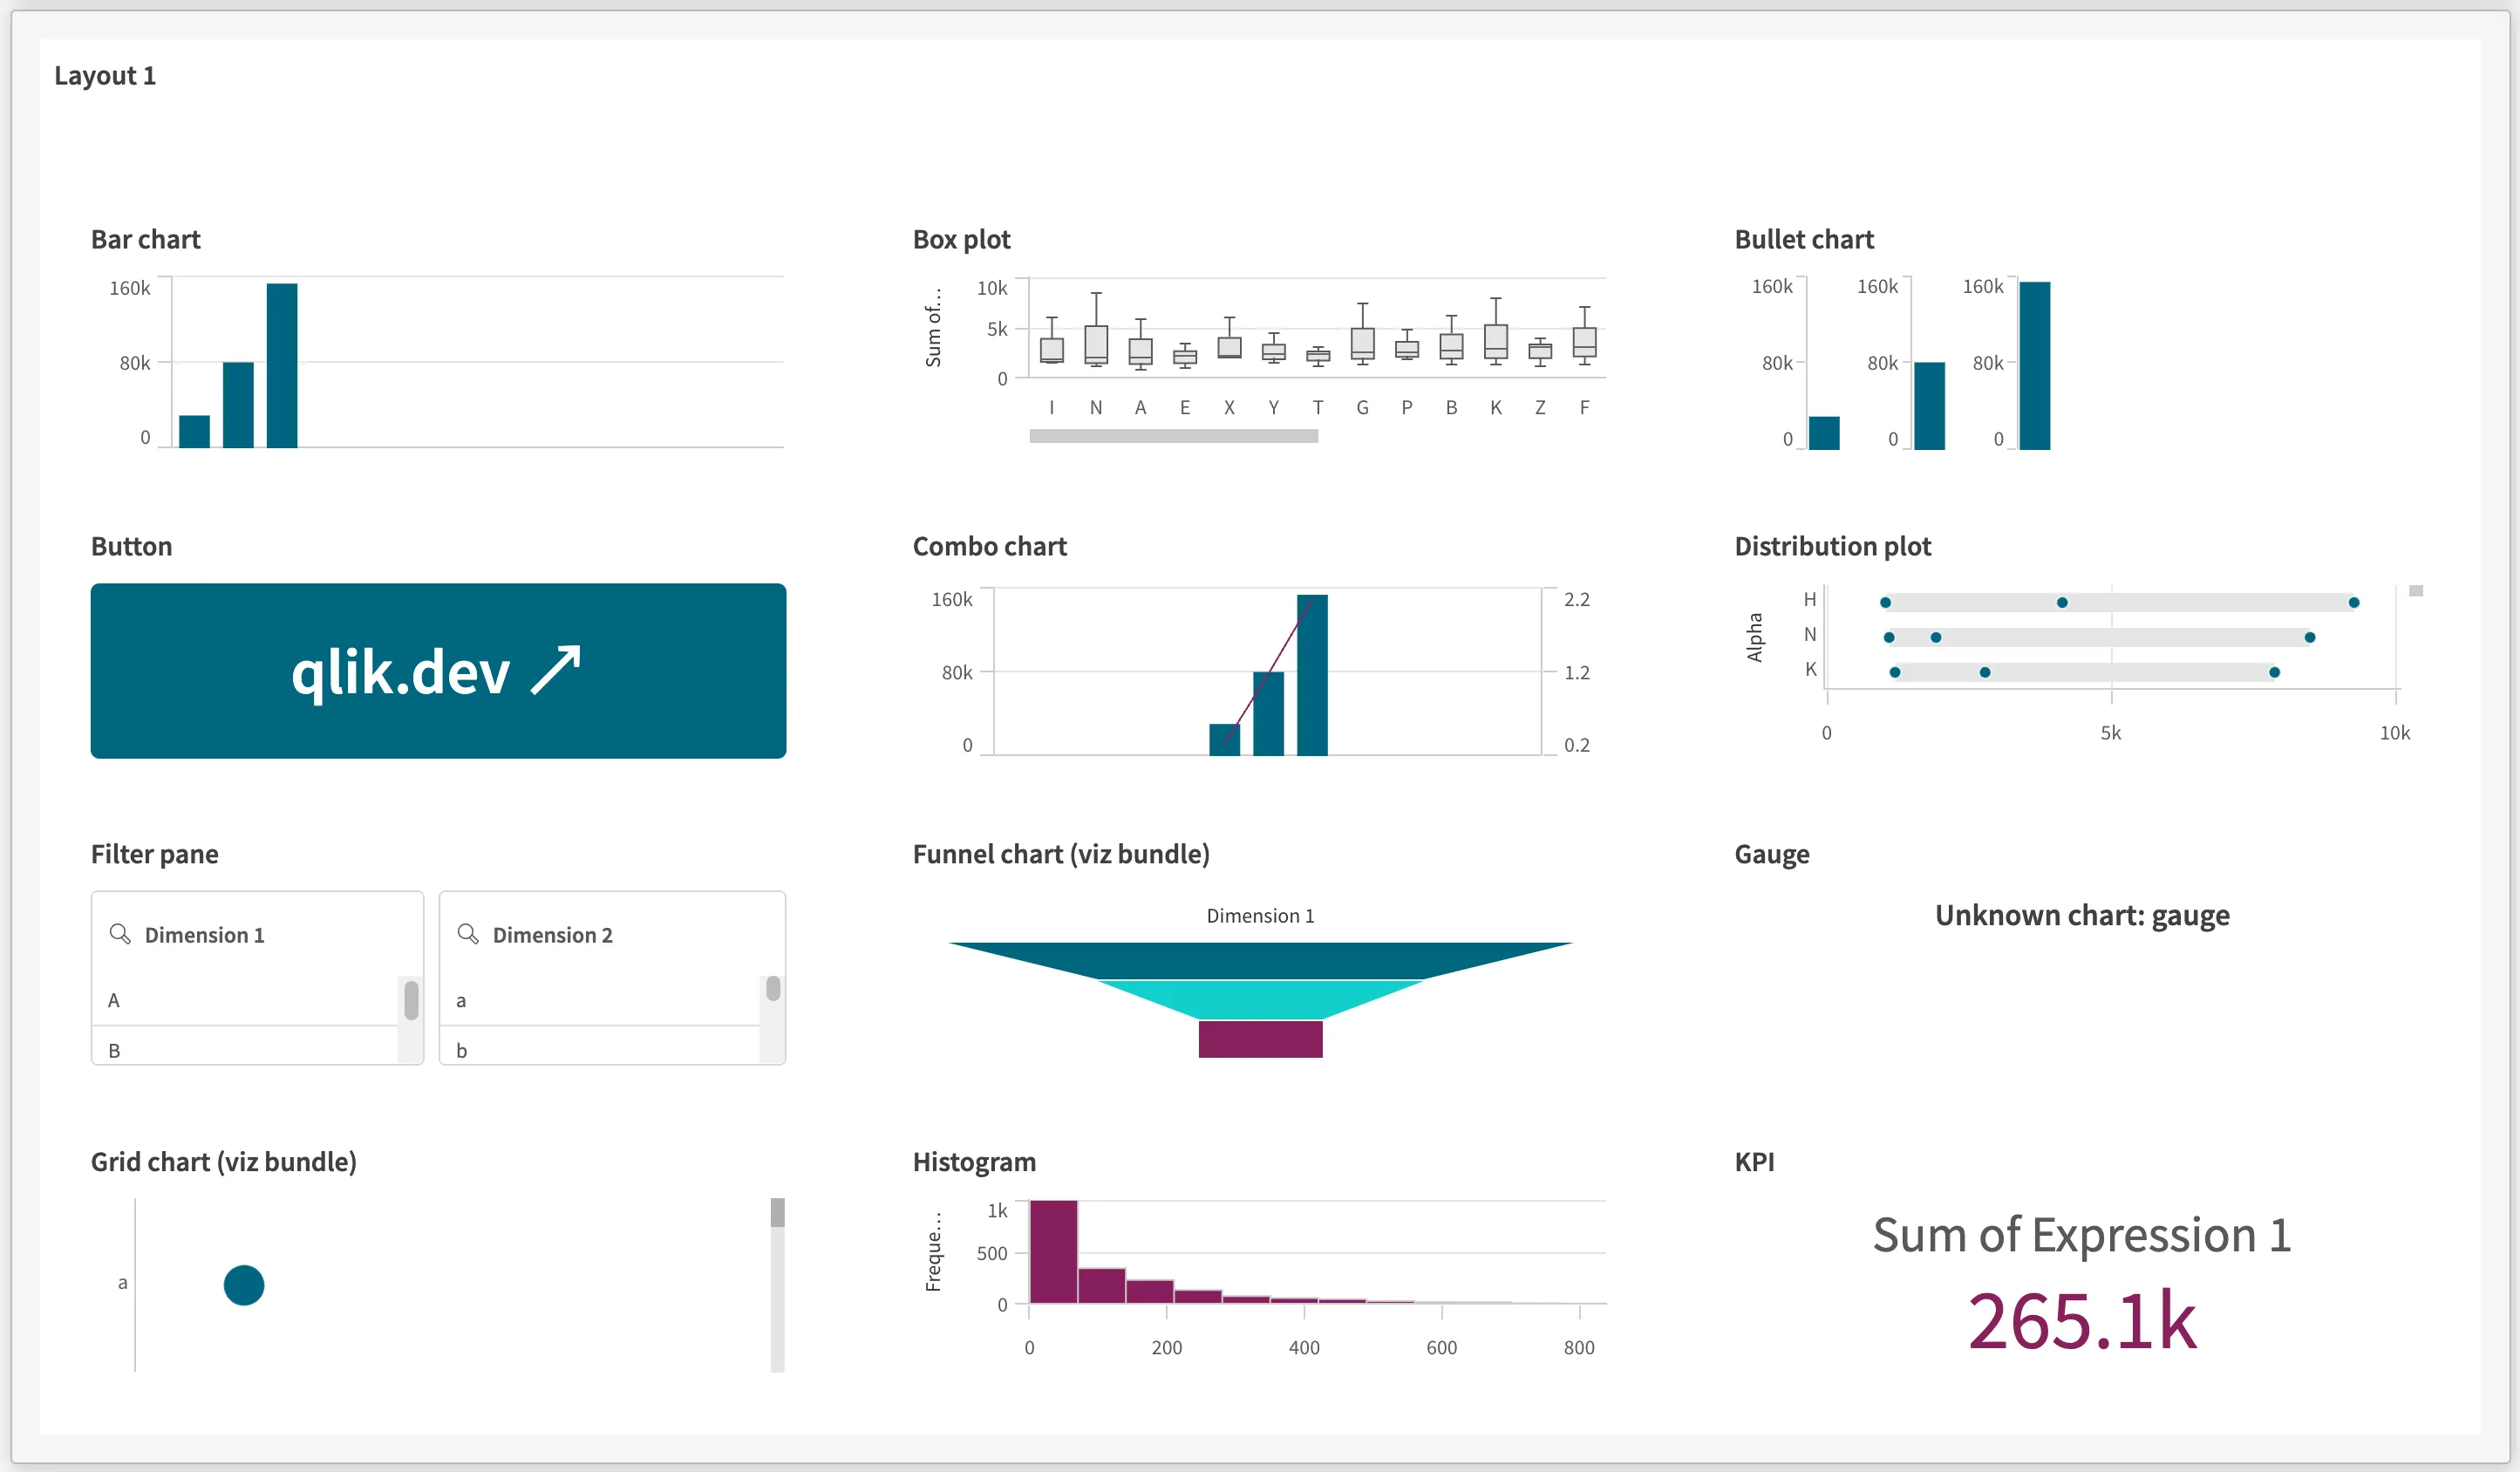
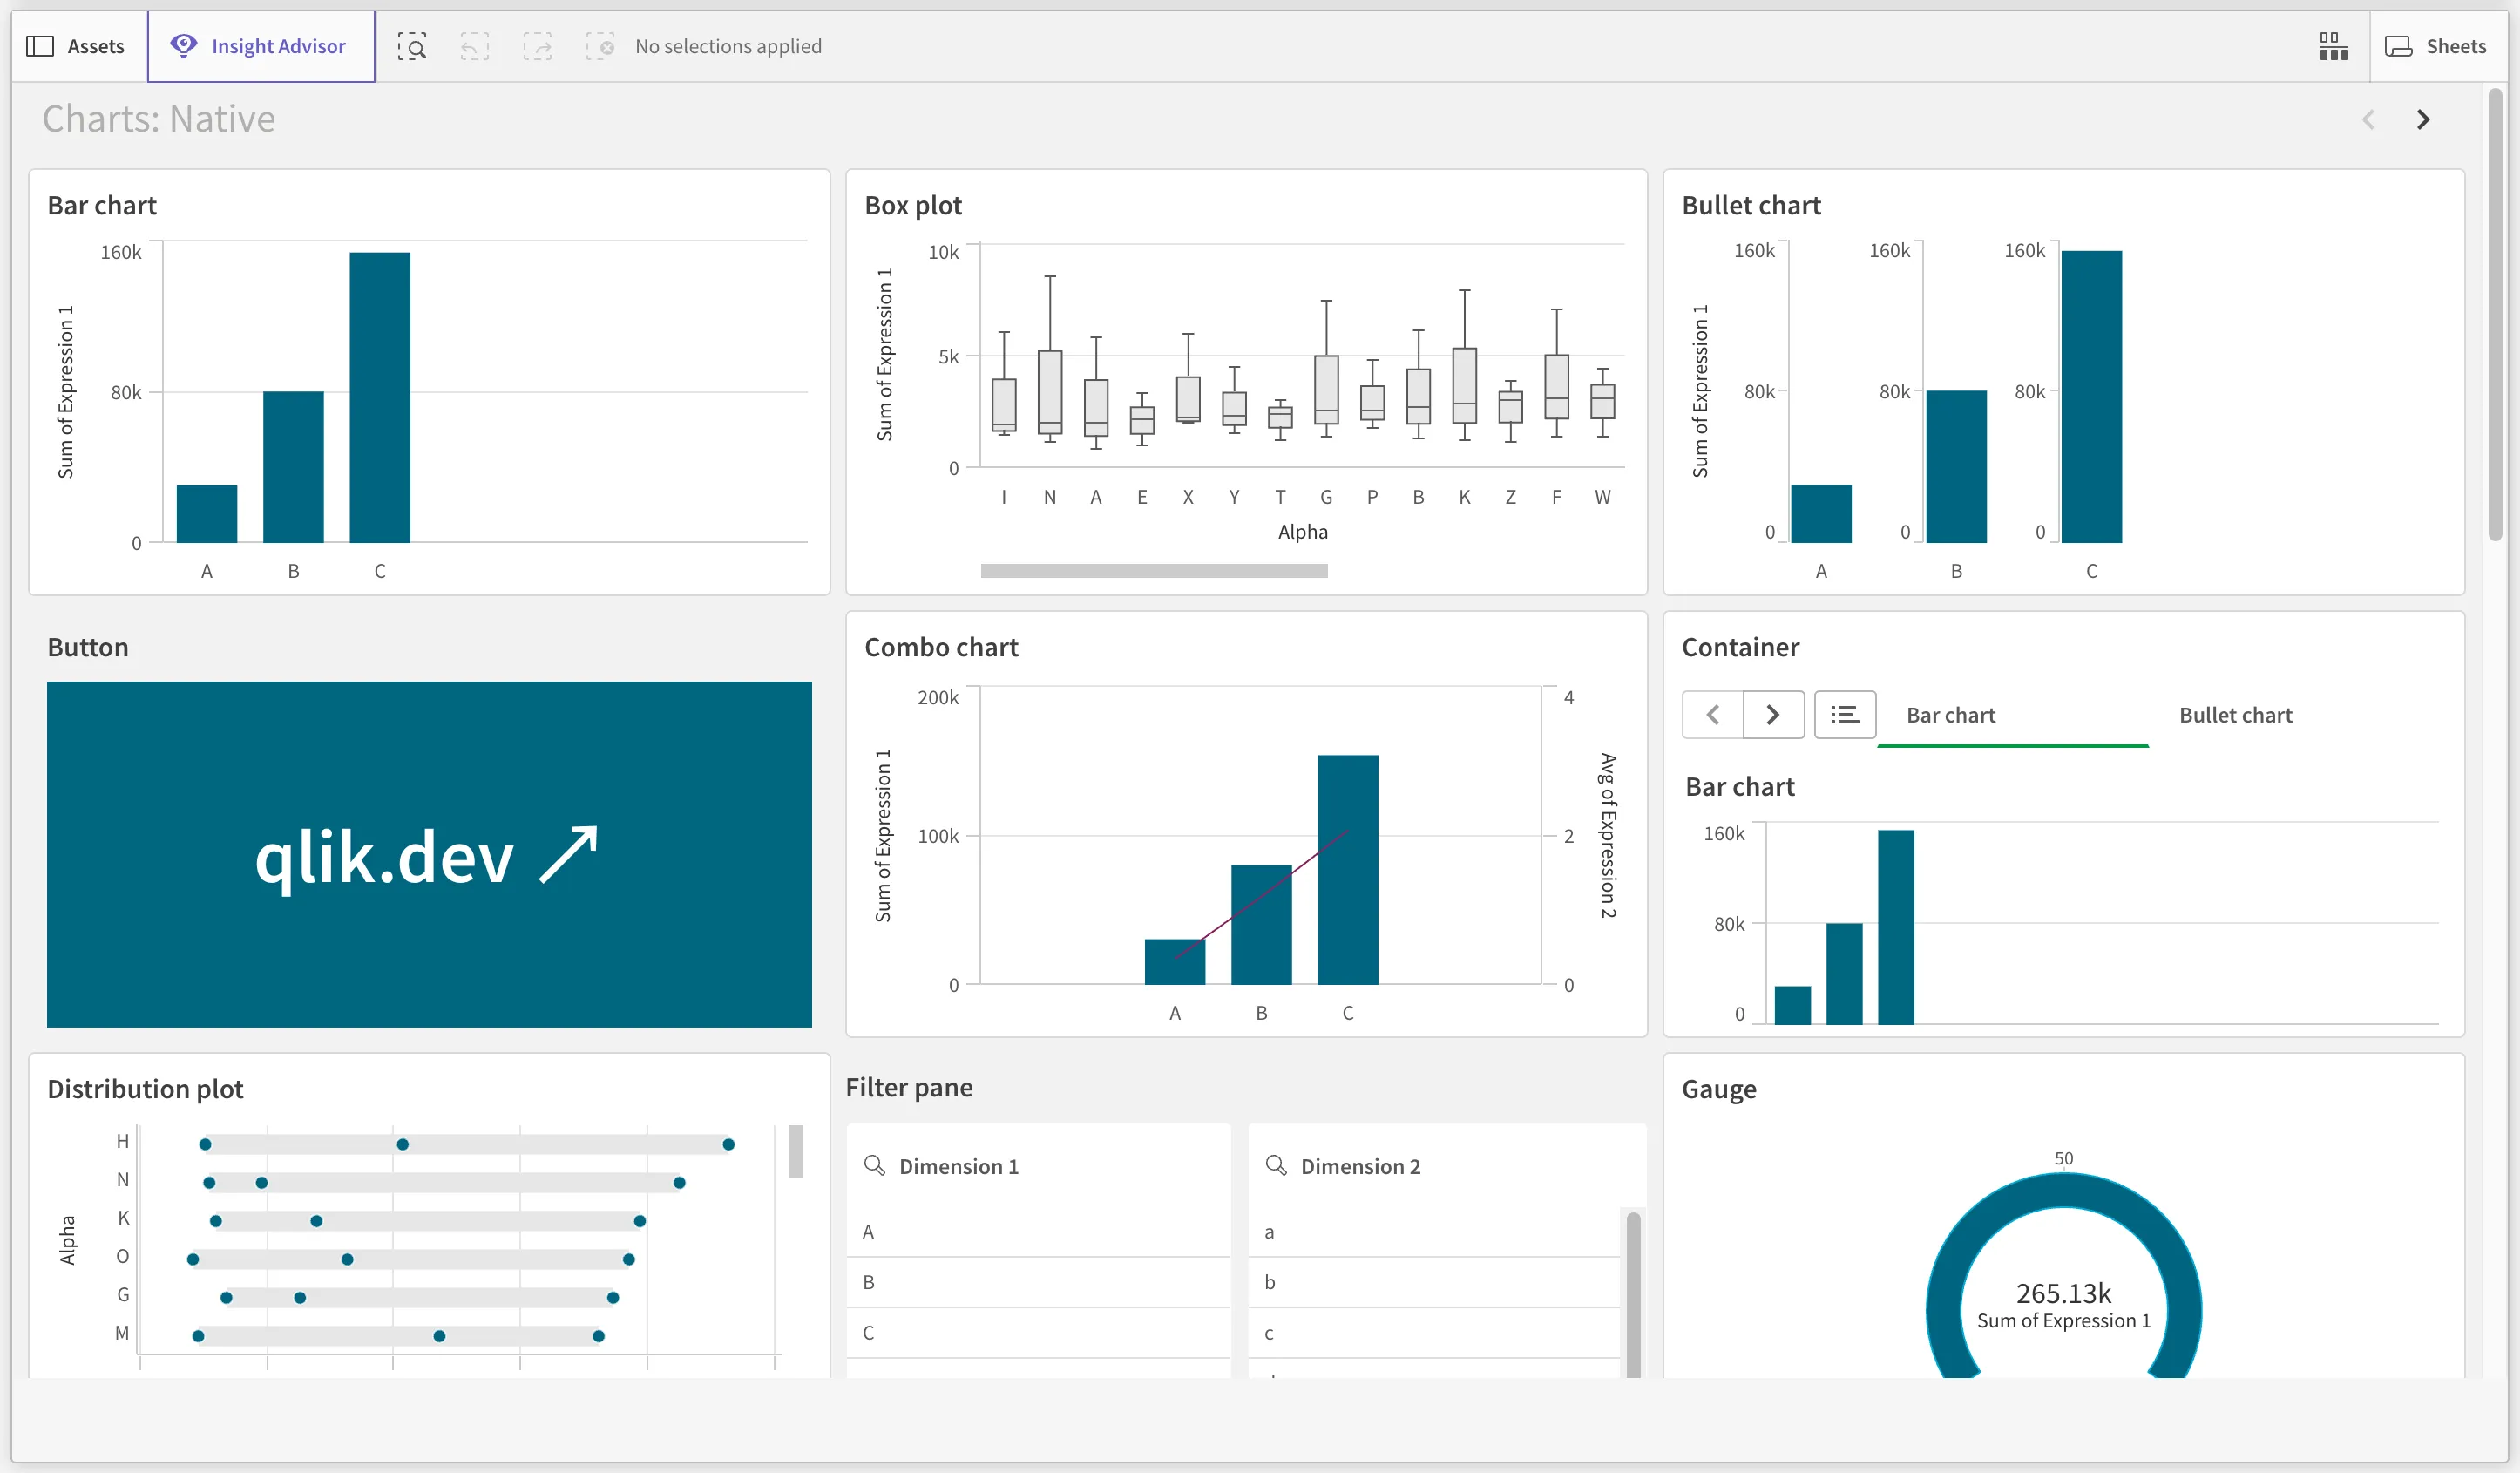
analytics/sheet
The analytics sheet is a lightweight component designed to bring the primary Qlik Sense experience to users, with full selectivity, but without capabilities such as data alerts, notes, subscriptions, etc. You can leverage the Qlik Cloud APIs to add desired capabilities into your web app using the framework of your choice.
There is no context menu provided, so you can build a menu that suits your host web app, and your use case.
Some charts, such as the KPI object, may require the page to use UTF-8 encoding.
Basic syntax
Supports sheets containing only nebula.js visualizations. For more information about nebula.js visualizations, see the Visualizations overview.
Use sheet-id to specify which sheet to display:
<qlik-embed ui="analytics/sheet" app-id="<APP_ID>" sheet-id="<SHEET_ID>"></qlik-embed>analytics/chart
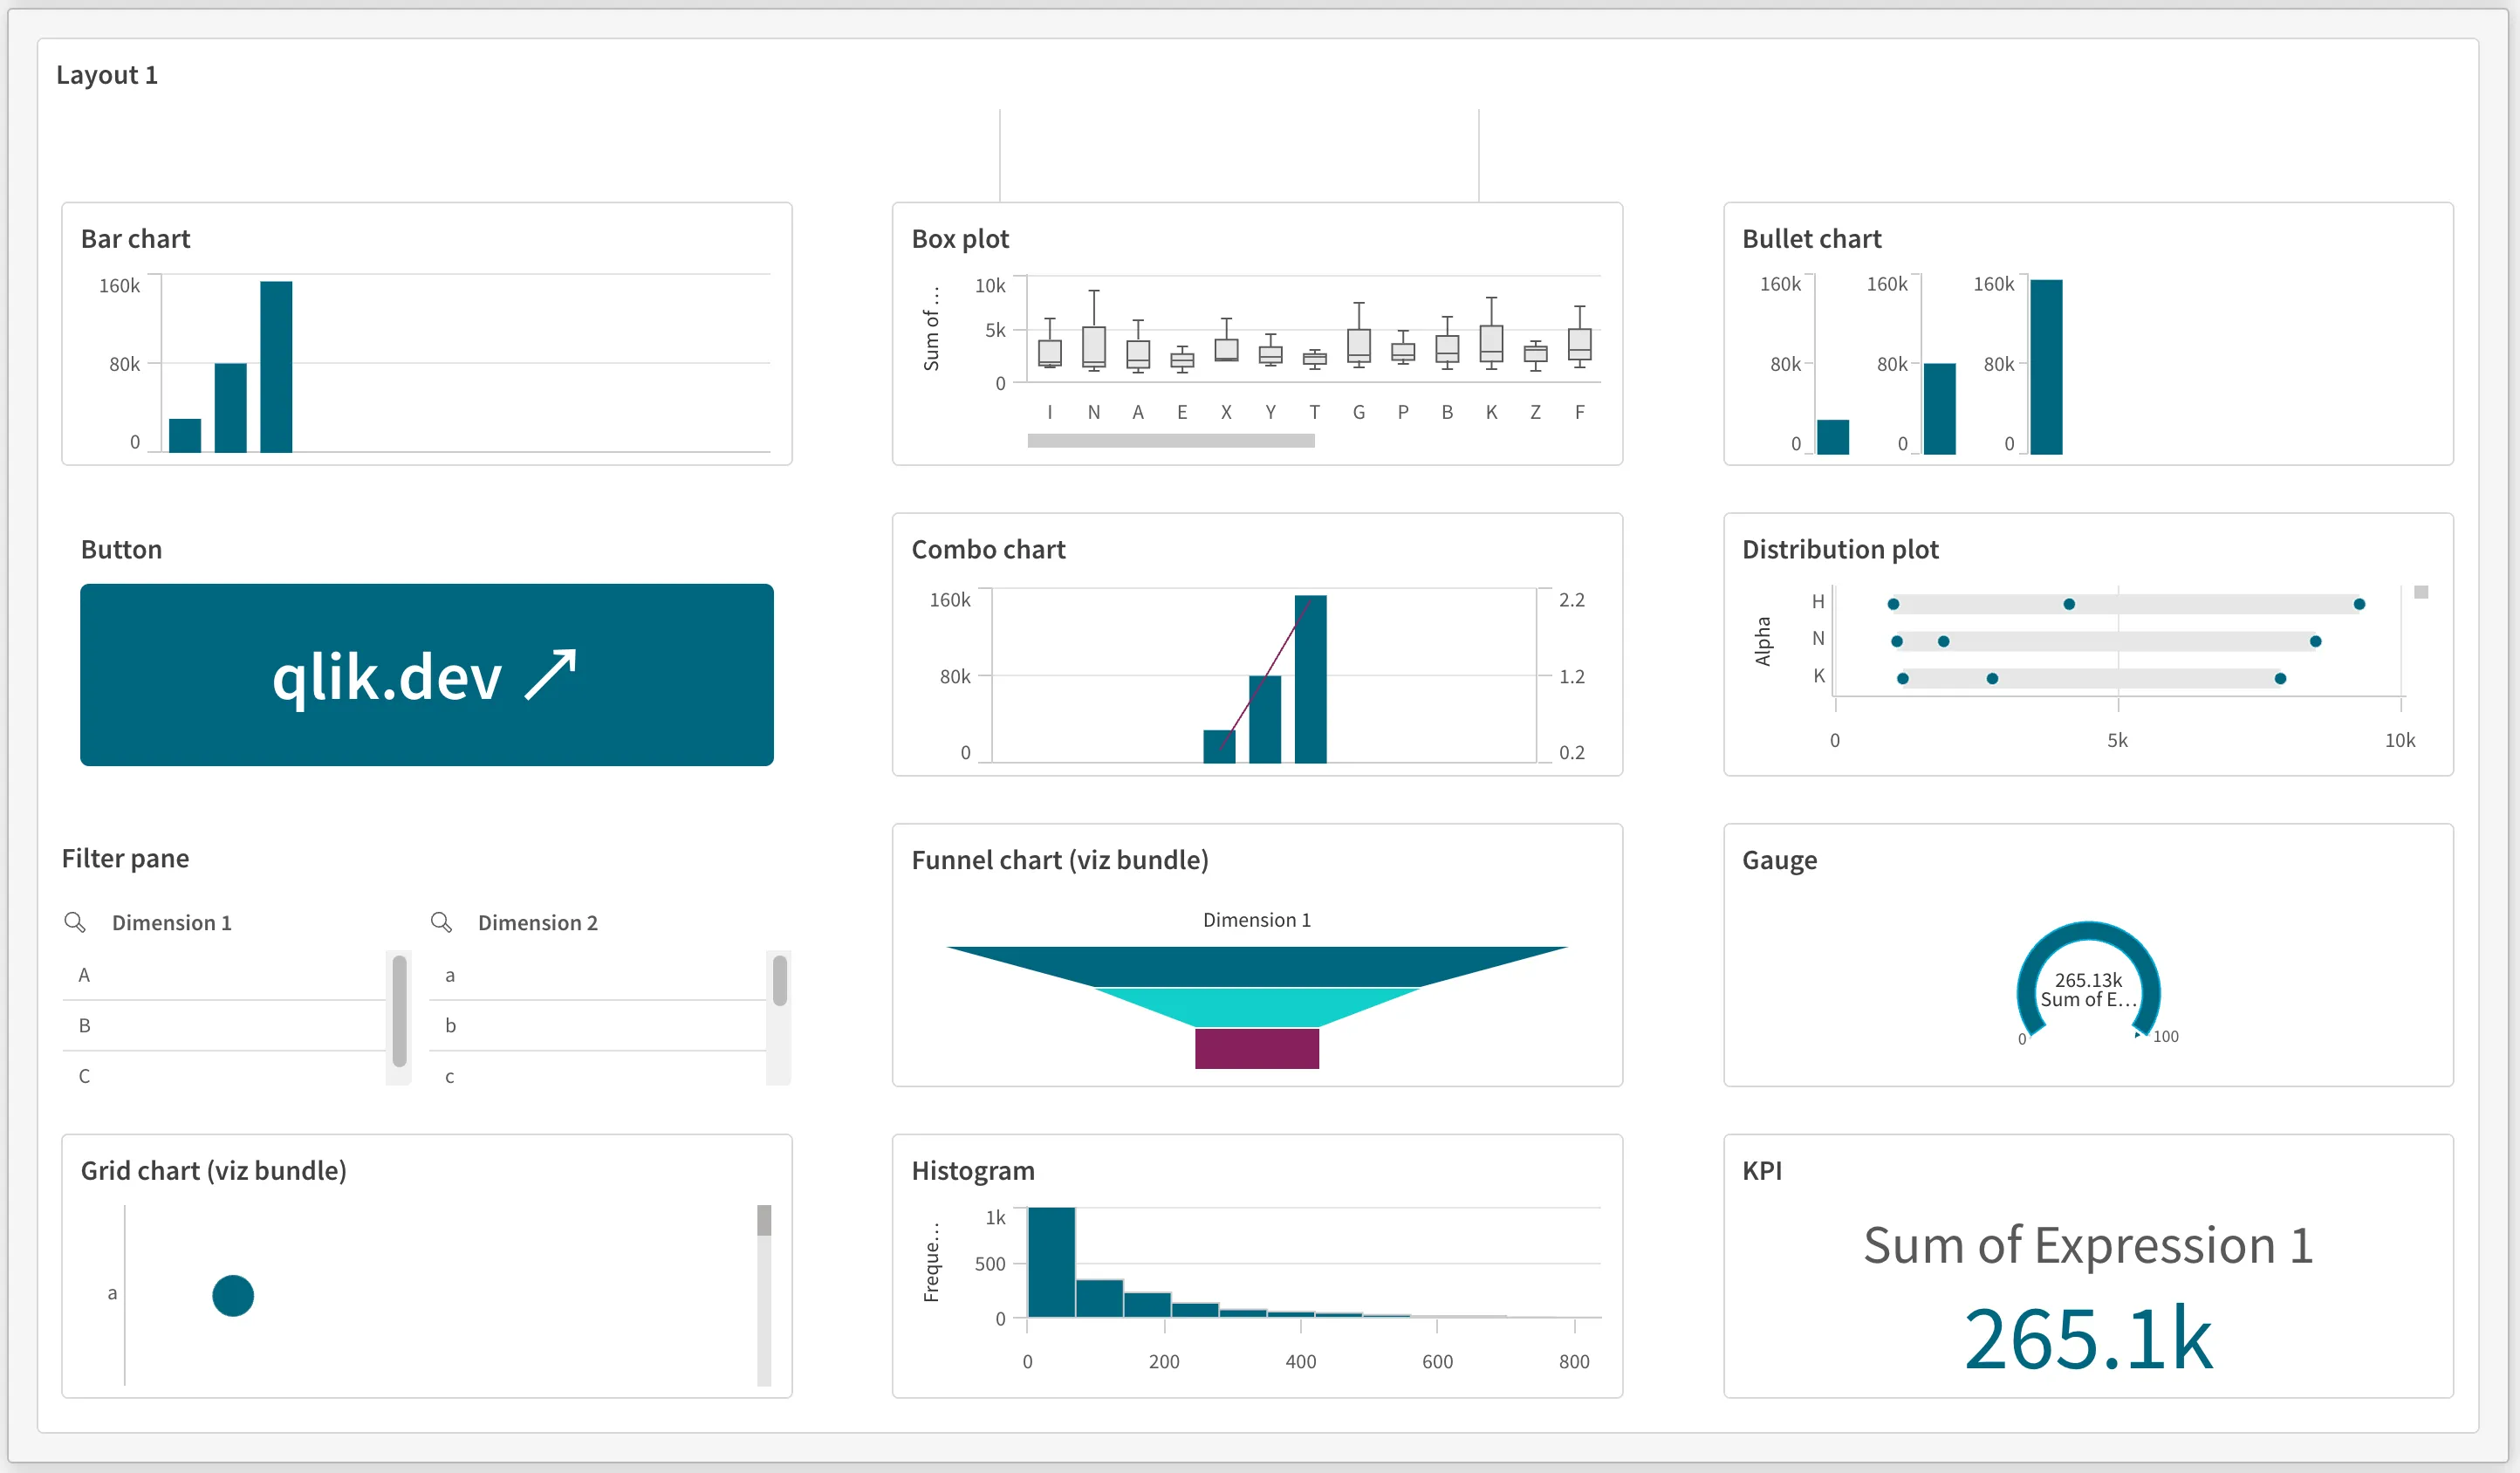
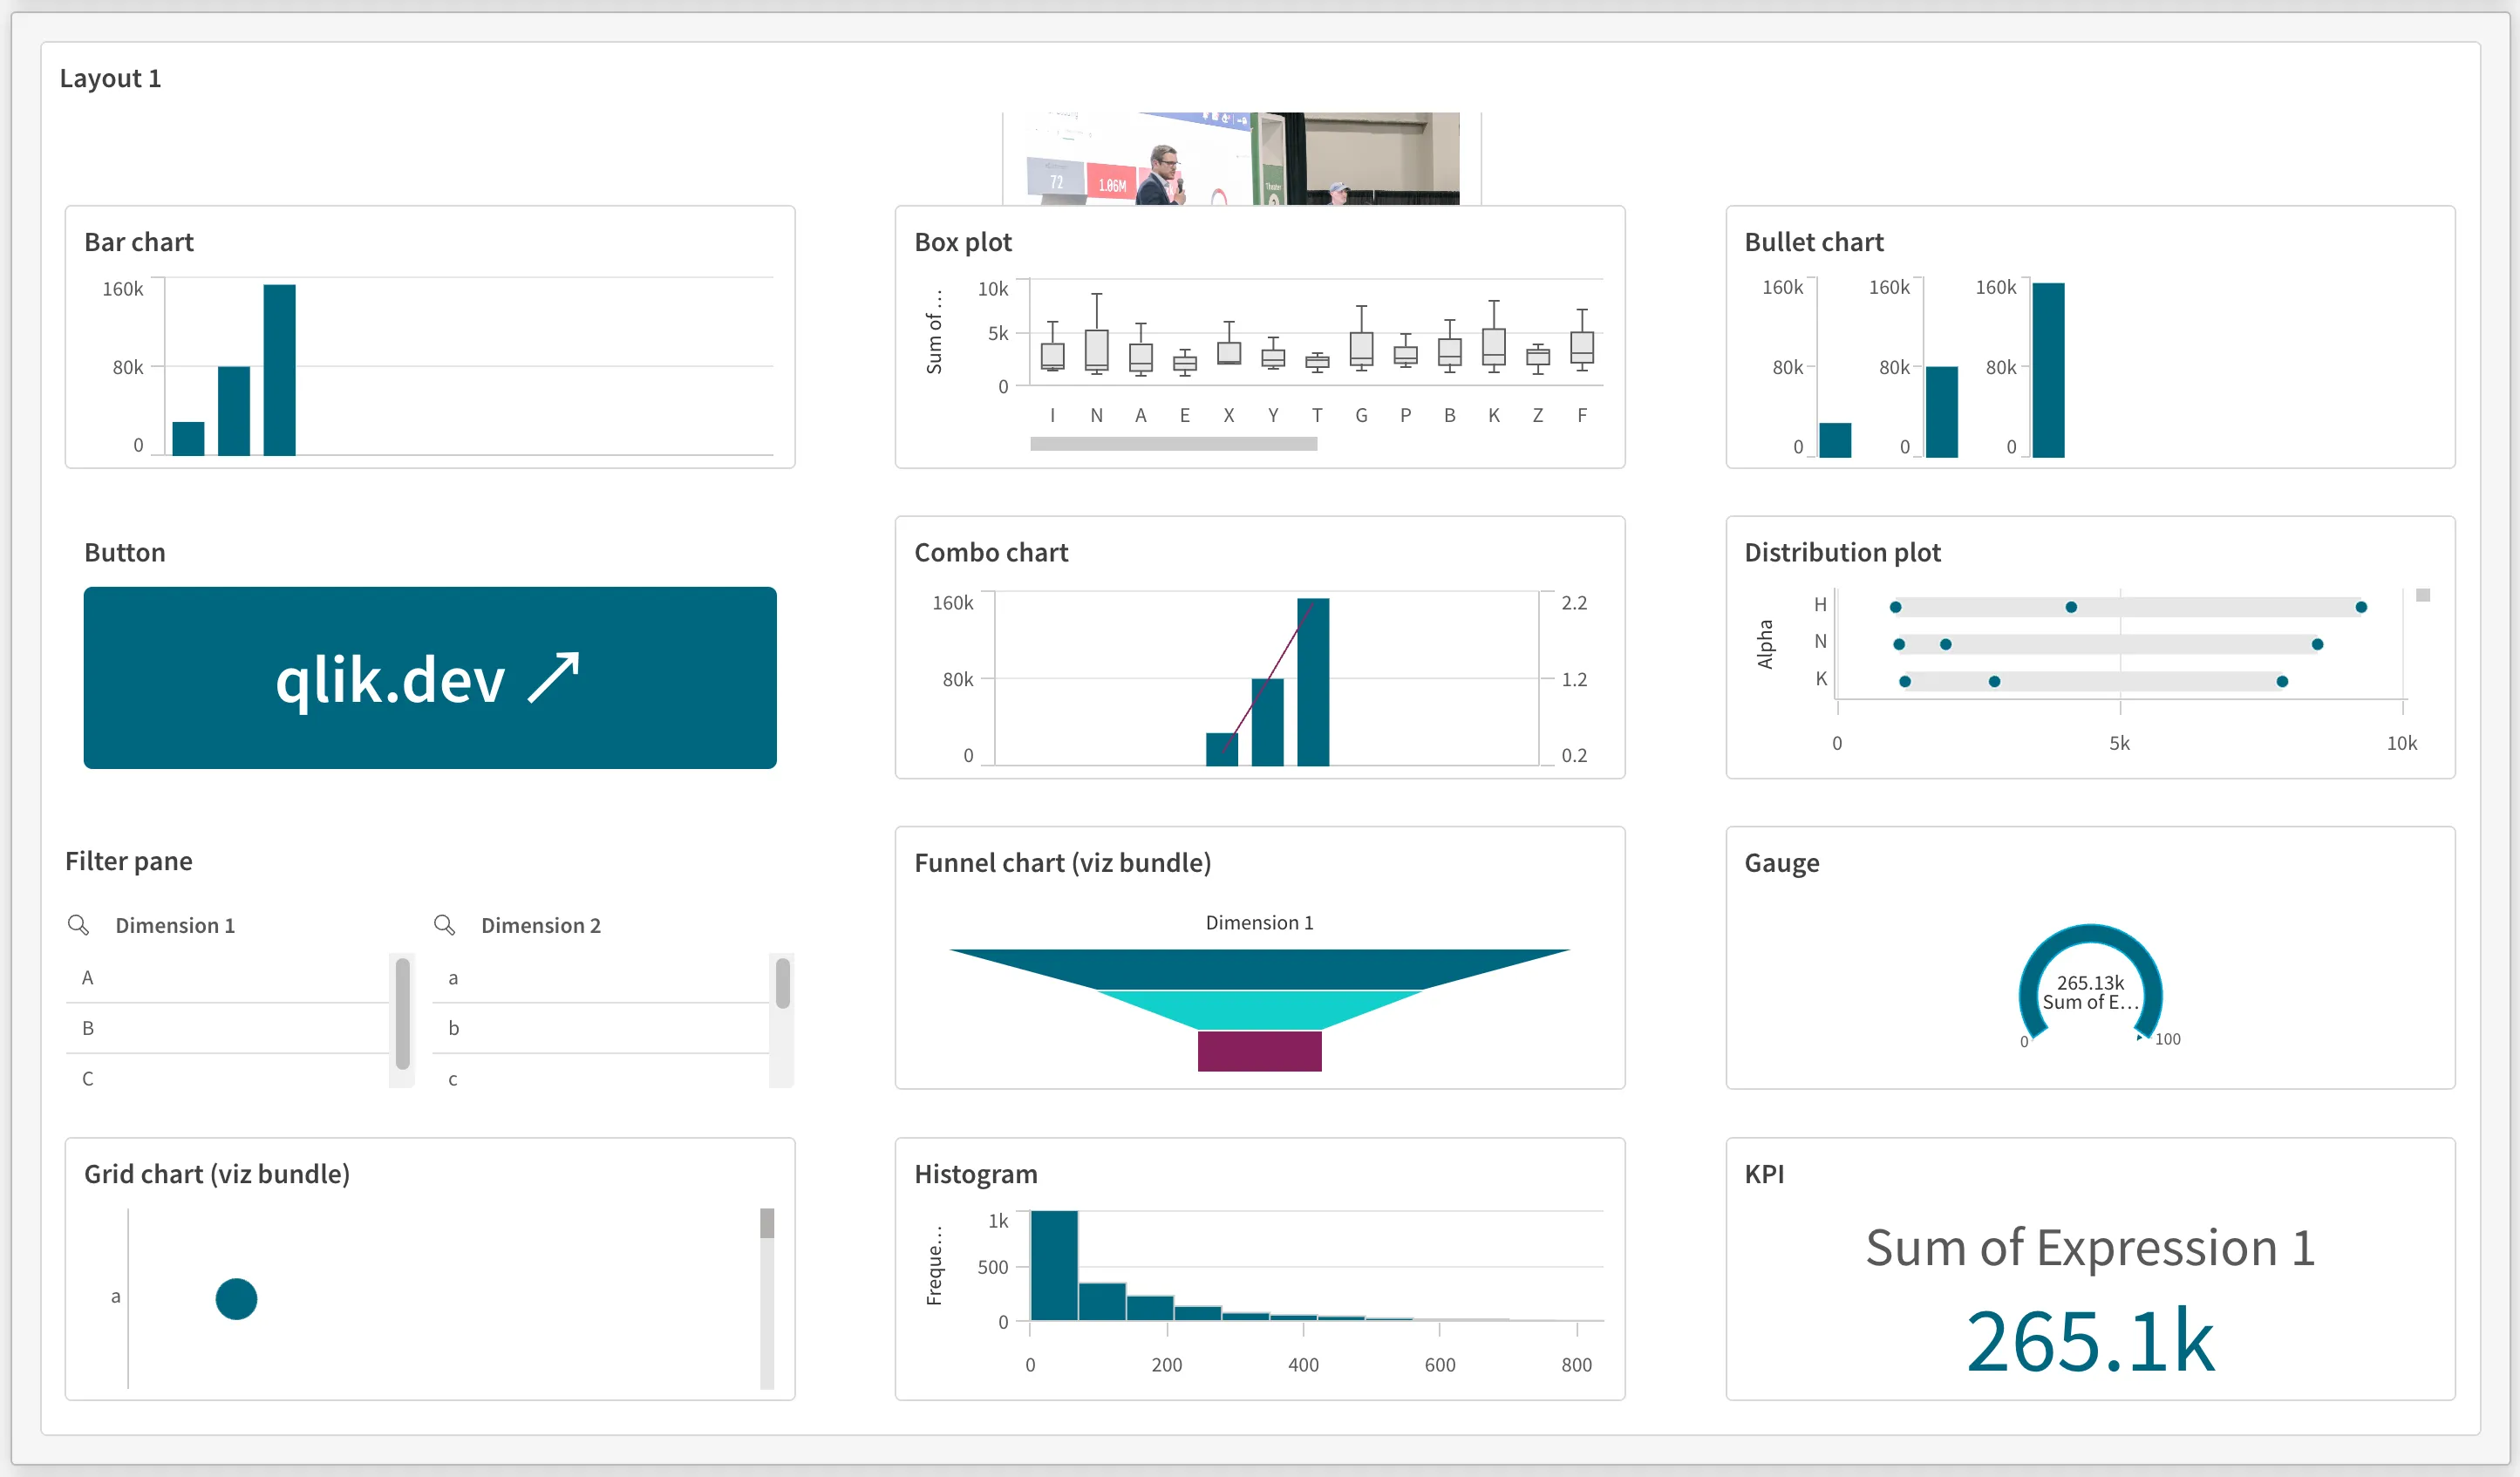
As with analytics/sheet, the analytics chart provides a lightweight experience
for single charts, allowing you to build much more complex web apps with better
performance than legacy iframe or angular frameworks.
With the addition of the layout container chart object, you can opt to include either simple single objects, or complex, layered collations of charts and objects from within your app with this UI.
There is no context menu provided, so you are free to build a menu which suits the host web app, and your use case.
Basic syntax
Supports nebula.js objects only. For more information about nebula.js objects, see the Visualizations overview.
<qlik-embed ui="analytics/chart" app-id="<APP_ID>" object-id="<OBJECT_ID>"></qlik-embed>For charts created on the fly, use data-definition instead of object-id to pass an inline
definition. For a full example, see
Chart on the fly. For full qDef
dimension and measure objects with custom labels, see
Create a chart on the fly with custom dimensions and measures.
analytics/field
The analytics field provides a lightweight listbox (filter pane) for allowing users to make selections in a single field within the app data model.
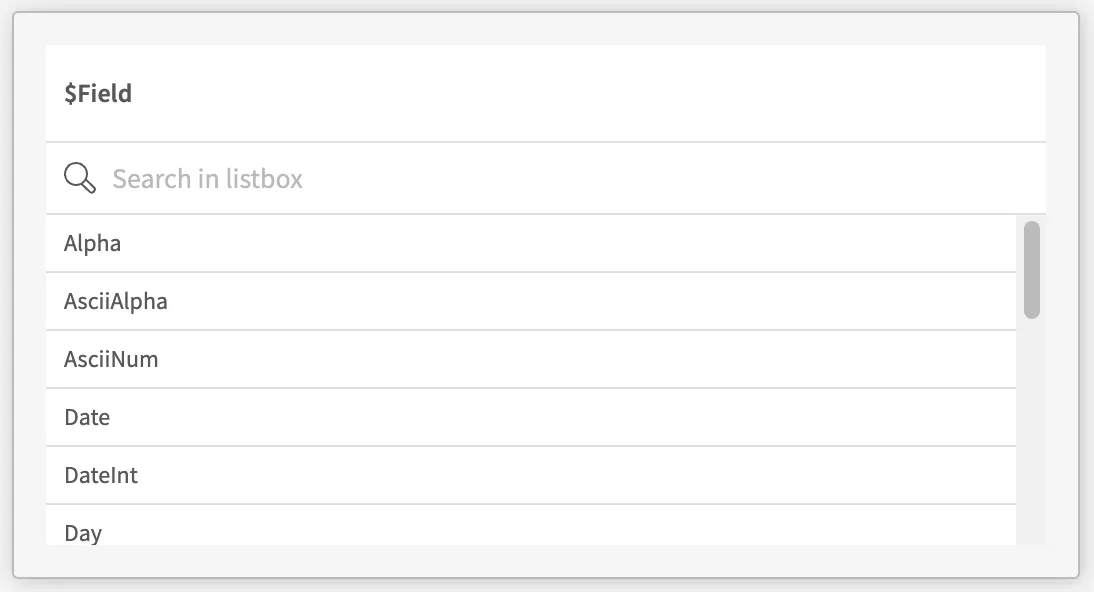
Basic syntax
Supply a field name:
<qlik-embed ui="analytics/field" app-id="<APP_ID>" field-id="<FIELD_NAME>"></qlik-embed>Alternatively, use a dimension or measure object:
<qlik-embed ui="analytics/field" app-id="<APP_ID>" library-id="<OBJECT_ID>" type="dimension"></qlik-embed>analytics/selections
This UI renders a default Qlik Sense selections bar, with back, forward, and clear selection buttons. Selections made in fields in the app will appear in this selections bar, where the user will be able to further refine or update selections in those fields without going to another UI type.

For programmatic selection control — such as clearing all selections, navigating undo/redo history, or making selections via script — use the ref API.
Basic syntax
<qlik-embed ui="analytics/selections" app-id="<APP_ID_FROM_QLIK_ANALYTICS>" ></qlik-embed>analytics/snapshot
The analytics/snapshot UI renders a static, non-interactive Qlik chart using a JSON payload you provide.
This payload can be pulled from a live object elsewhere or generated by sharing tasks.
It can be loaded from a backend API or a static file.
This UI does not require a Qlik Sense engine session or authentication, and all resources are loaded from the Qlik CDN.
Use this UI to display charts or KPIs instantly, without interactivity or live data connection (only works in noauth
mode).
For a step-by-step example, see the offline snapshot quick start.
insights/feed-cards
The insights/feed-cards UI renders a scrollable list of insight feed cards powered by the
Discovery Agent
in your web app. Use it to surface automatically generated insights from the
signed-in user’s available apps without embedding the full Qlik Sense client.
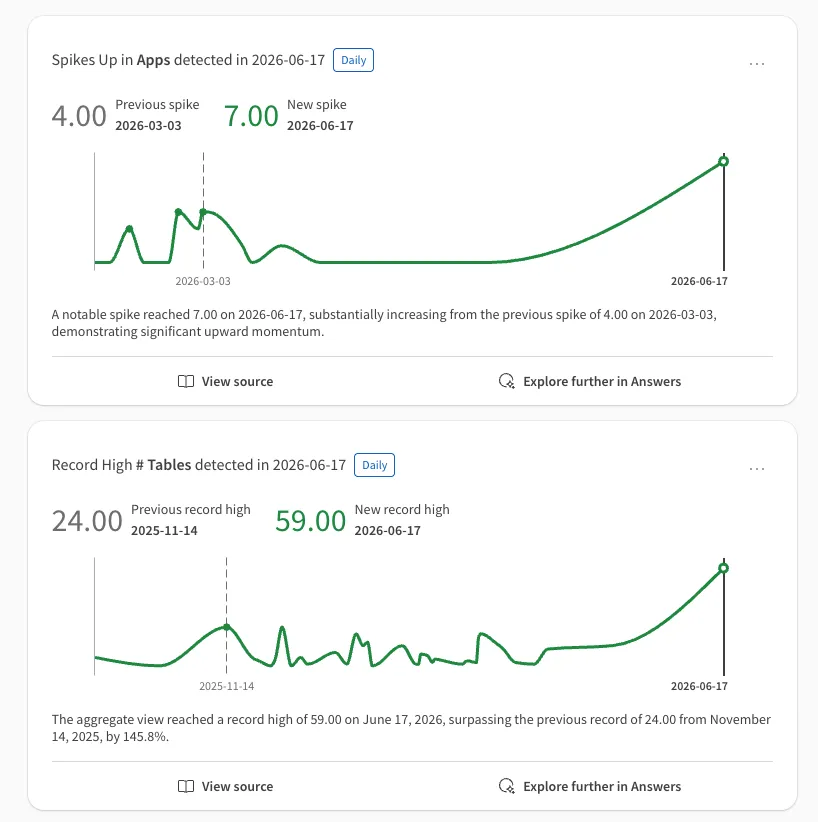
Insights are generated when application data changes and noteworthy trends, anomalies, or deviations are detected. Each card displays a trend-based insight with a title, summary, chart, and key performance indicators (KPIs). End users can expand cards for more details, link to the source app, or explore further using Qlik Answers if enabled.
For more information about feeds and how users interact with insights, see Analyzing Discovery Agent feeds in Qlik Help.
- Discovery agent must be available and enabled in your tenant for the accessing user.
- The user must have an app on which insight triggers have been created and evaluated for insights to appear in the feed.
- OAuth authentication is required.
Basic syntax
Use app-id to filter the feed cards to a specific app:
<qlik-embed ui="insights/feed-cards" app-id="<APP_ID>"></qlik-embed>Omit app-id to render all available feed cards for the signed-in user.
Filtering via other parameters like analysis type is not currently supported by this UI.
You can filter by app-id only.
show-source
Controls whether the “View source” action is visible on feed cards. Set to true to show the
action, or false to hide it. Defaults to true.
When enabled, users can click View source to access details about the insight, including:
- The source application and sheet
- Date and time of creation
- The insight trigger that generated the insight
- Dimensions, measures, and breakdown dimensions
- Applicable filters and bookmarks
When using the qlik-embed web component, add the :boolean type suffix to this parameter.
Usage:
<qlik-embed ui="insights/feed-cards" app-id="<APP_ID>" show-source:boolean="false"></qlik-embed> intercept-app-navigation
Controls how the “View source” action navigates to the app.
When set to true, clicking the action dispatches a qlik-embed:app-navigate-requested
event instead of opening a new browser tab. This allows you to handle app navigation within
your host application. The event detail includes the app ID: { appId: '<APP_ID>' }.
When omitted or set to false, clicking the app link in the Source Details section opens
the app in a new browser tab. The app URL is resolved using the authenticated tenant host
from your authentication configuration. This ensures the app opens in the correct tenant for
multi-tenant scenarios.
This parameter is useful when you want to control how users navigate from insights to the source application. For example, to open the app in a modal, navigate within a single-page application, or log navigation events.
When using the qlik-embed web component, add the :boolean type suffix to this parameter.
Usage:
To handle navigation in your own application, listen for the event on the <qlik-embed>
element in your host page:
const embedElement = document.querySelector('qlik-embed');embedElement.addEventListener('qlik-embed:app-navigate-requested', (event) => { const appId = event.detail.appId; console.log('Navigate to app:', appId); // Add your custom navigation logic here});Then set intercept-app-navigation:boolean="true" on the embed tag:
<qlik-embed ui="insights/feed-cards" app-id="<APP_ID>" show-source:boolean="true" intercept-app-navigation:boolean="true"></qlik-embed>classic/app
This UI renders the Qlik Sense sheet analysis and authoring client, bringing most of the UIs and modals present in that experience to your users. Capabilities such as data alerts, insight advisor, subscriptions, self-service authoring of new sheets, and more, are available out of the box with the standard context menu.
Some context menu items are hidden when embedding with classic/app. These items are:
- For sheets: Embed and Create link
- In bookmarks: Copy link
This UI exposes analytics sheets in either analysis or authoring (edit) views, it does not support stories, data manager, data load editor, data model viewer, or any other UI types other than sheet.
In this experience, there are still some limitations or considerations for using certain features, although Qlik is working to bring the full native experience:
-
Alerts, subscriptions, and monitored charts UIs accessed from context menu will redirect to the Qlik Cloud hub. Turn off these features in the tenant and assign users the Embedded Analytics User role to prevent users from accessing the Qlik Cloud hub.
-
The microphone input in Insight Advisor will not accept audio inputs.
This UI emits the Qlik Sense sheet usage event, allowing you to understand which sheets were accessed by your users. No other UIs support this event.
Basic syntax
<qlik-embed ui="classic/app" app-id="<APP_ID_FROM_QLIK_ANALYTICS>" theme="<NAME_OF_THEME>" sheet-id="<SHEET_ID_FROM_APP>" bookmark="<BOOKMARK_ID_FROM_APP>" clear-selections="choiceOf: 'true' or 'false'" clear-state="<STATE_NAME_TO_CLEAR>" select:json="[{field:'<FIELD_NAME_FROM_APP>',values:['<FIELD_VALUE_OF_FIELD>','<FIELD_VALUE_OF_FIELD>']}]" ></qlik-embed> Initial selections and state (classic/app)
You can set the initial selection state for a classic/app embed using the
following attributes. These are specific to classic/app and have no effect on
analytics UIs - for those, use qlik-initial-selections.
-
clear-selections="true": Clears any unlocked selections in the app before the embed loads. -
select: Applies one or more field selections on load. Pass a JSON array of objects, each with afieldstring and avaluesarray:<qlik-embedui="classic/app"app-id="<APP_ID>"sheet-id="<SHEET_ID>"clear-selections="true"select="[{field:'Region',values:['North','South']}]"></qlik-embed>Multiple fields can be selected by adding more objects to the array:
select="[{field:'Region',values:['North']},{field:'Year',values:['2024']}]" -
bookmark-id: Applies a bookmark to restore a saved selection state:<qlik-embedui="classic/app"app-id="<APP_ID>"sheet-id="<SHEET_ID>"bookmark-id="<BOOKMARK_ID>"></qlik-embed>
clear-selections and select apply only when sheet-id is provided.
When sheet-id is omitted (loading the app overview), these
attributes are silently ignored.
If you need selections applied regardless of the landing view, use
qlik-initial-selections instead.
This sets state at the session level before any UI renders.
classic/chart
This UI renders visualizations that have not been converted to nebula.js or use the classic extension API with the use if it’s iframe mode.
There is no context menu provided, so you are free to build a menu which suits the host web app, and your use case.
With the addition of the layout container chart object, you can opt to include either simple single objects, or complex, layered collations of charts and objects from within your app with this UI.
Basic syntax
Standard usage:
<qlik-embed ui="classic/chart" app-id="<APP_ID>" object-id="<OBJECT_ID>"></qlik-embed>For extensions, use iframe mode:
<qlik-embed ui="classic/chart" app-id="<APP_ID>" object-id="<OBJECT_ID>" iframe="true"></qlik-embed>Review visualizations for compatibility information.
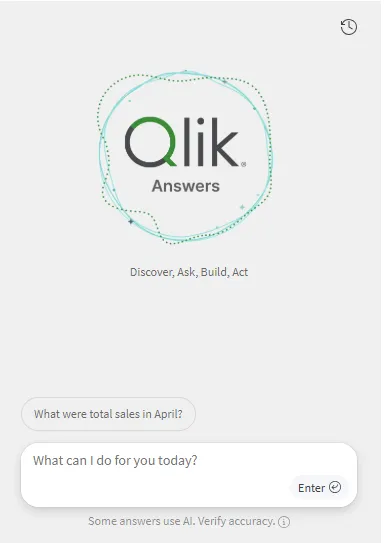
ai/agentic-assistant
The AI agentic assistant component brings you the agentic Qlik Answers experience in embedded format. It uses knowledge bases and analytics apps together to surface insights and take action.
To use the agentic Qlik Answers experience, you must opt in to cross-region inference. This allows Qlik Cloud to temporarily process data outside your tenant region. For more information, see the Qlik Answers documentation on Qlik Help.
Requires OAuth authentication and a Qlik Cloud user with access to the assistant. For more information, see Auth overview.
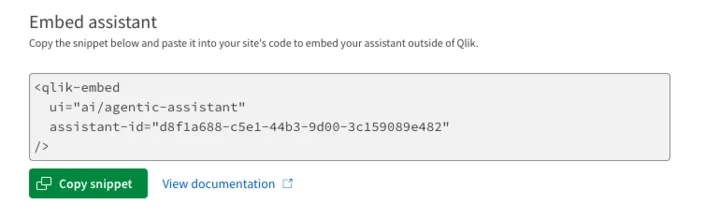
Basic syntax
<qlik-embed ui="ai/agentic-assistant" assistant-id="<ASSISTANT_ID>" appearance="qlik-light"></qlik-embed>The value for <ASSISTANT_ID> can be found in the URL after opening your assistant, for example
in https://tenant.region.qlikcloud.com/assistant/880c5981-77cd-4cb7-b79c-09d26c0b97a7/summary
it would be 880c5981-77cd-4cb7-b79c-09d26c0b97a7.
You can also copy the embed code snippet from the assistant’s settings:
ai/assistant (legacy)
The AI assistant component brings you the legacy Qlik Answers experience in embedded format.
Use this UI as a quick retrieval-augmented generation (RAG) tool to search your knowledge bases.
ai/assistant supports two themes:
- Light mode (default), set with
appearance="qlik-light" - Dark mode, set with
appearance="qlik-dark"
Basic syntax
<qlik-embed ui="ai/assistant" assistant-id="<ASSISTANT_ID>" appearance="qlik-light"></qlik-embed>The value for <ASSISTANT_ID> can be found in the URL after opening your assistant, for example
in https://tenant.region.qlikcloud.com/assistant/880c5981-77cd-4cb7-b79c-09d26c0b97a7/summary
it would be 880c5981-77cd-4cb7-b79c-09d26c0b97a7.
To resume a specific conversation thread, supply the thread ID with thread-id:
<qlik-embed ui="ai/assistant" assistant-id="<ASSISTANT_ID>" thread-id="<THREAD_ID>" appearance="qlik-light"></qlik-embed>UI configuration
Once you’ve put the relevant script header into your web app, and configured any authentication, you can add qlik-embed tags to the page.
You set the UI type in the qlik-embed tag in <ui>:
<qlik-embed ui="<ui>" ...></qlik-embed>Each UI type will support a specific set of properties, which are detailed below.
Setting UI parameters
The UI options are configured on the <qlik-embed> object as parameters, an
example for classic/app:
<qlik-embed ui="classic/app" app-id="7973436d-250c-46a8-bca3-8448556c5457" sheet-id="ayLHeE" theme="breeze"></qlik-embed>This sets:
- The UI to
classic/appwithui="classic/app". - The Qlik Sense app loaded to
7973436d-250c-46a8-bca3-8448556c5457withapp-id="7973436d-250c-46a8-bca3-8448556c5457". - The sheet opened in the Qlik Sense app to
ayLHeEwithsheet-id="ayLHeE". - The theme used in the app to
breezewiththeme="breeze".
Configurable UI parameters
Not all UI parameters are supported in all modes. Parameters marked with (context)
must be set within the context___json attribute as a JSON object.
| analytics/chart | analytics/field | analytics/selections | analytics/sheet | classic/app | classic/chart | |
|---|---|---|---|---|---|---|
| deviceType (context) | ✔ | ✔ | ✔ | ✔ | ✖️ | ✖️ |
| disableCellPadding (context) | ✔ | ✔ | ✔ | ✔ | ✖️ | ✖️ |
| identity | ✔ | ✔ | ✔ | ✔ | ✔ | ✔ |
| interactions (context) | ✔ | ✔ | ✔ | ✔ | ✖️ | ✖️ |
| keyboardNavigation (context) | ✔ | ✔ | ✔ | ✔ | ✖️ | ✖️ |
| language | ✖️ | ✖️ | ✖️ | ✖️ | ✔ | ✖️ |
| override-properties___json | ✔ | ✖️ | ✖️ | ✖️ | ✖️ | ✖️ |
| preview | ✔ | ✖️ | ✖️ | ✔ | ✖️ | ✖️ |
| theme | ✔ | ✔ | ✔ | ✔ | ✔ | ✔ |
deviceType (via context___json)
This parameter must be set in the context___json attribute.
Override the device type used for rendering. When not specified, the device type is detected automatically from the browser.
Usage:
<qlik-embed ... context___json="{deviceType:'desktop'}"></qlik-embed> disableCellPadding (via context___json)
This parameter must be set in the context___json attribute.
When set to true, removes the default cell padding applied to visualisation objects.
Useful when embedding charts in constrained layouts. Defaults to false.
Usage:
<qlik-embed ... context___json="{disableCellPadding:true}"></qlik-embed> identity
If a string is provided for identity, then a unique session will be generated
for that string for the current user. If blank, default session is used.
Objects on different sessions will not share selection states or other interactive states. Objects referencing the same identity will share the session.
Usage:
Example to set create a session under identity 123456a:
<qlik-embed ... identity="123456a"></qlik-embed> interactions (via context___json)
This parameter must be set in the context___json attribute.
The interactions parameter allows you to define the interactions that are
permitted within the object. You can specify a boolean value for each interaction
type. If not specified, the default value is true.
active: Allow interactions that affect the state of the object, such as selections, zoom, scroll (text scrolling is unaffected), etc.passive: Allow interactions with components such as tooltips to be made in the object.select: Allow selections (applying filtering of data) to be made in the object. Impliedfalsewhenactiveisfalse.edit: Allow the object to enter edit mode.
Usage:
Example to turn off all interactions and selections in the object:
<qlik-embed ... context___json="{interactions:{active: false, select: false, passive: false}}"></qlik-embed>The constraints parameter provides the same set of flags (active, passive, select, edit)
but with inverted semantics: setting constraints.active: true disables active interactions.
Prefer interactions for new implementations.
keyboardNavigation (via context___json)
This parameter must be set in the context___json attribute.
When set to true, enables keyboard navigation within the embedded object.
Defaults to false.
Usage:
<qlik-embed ... context___json="{keyboardNavigation:true}"></qlik-embed> language
Override default language settings by defining the language for the specific object. If not specified, the default language will be used.
Usage:
This will set interface languages to Spanish, using the short code es.
<qlik-embed ... language="es"></qlik-embed>Supported languages and codes:
| Language | Short code | Long code |
|---|---|---|
| Brazilian Portuguese | pt | pt-BR |
| Dutch | nl | nl-NL |
| English | en | en-US |
| French | fr | fr-FR |
| German | de | de-DE |
| Italian | it | it-IT |
| Japanese | ja | ja-JP |
| Korean | ko | ko-KR |
| Polish | pl | pl-PL |
| Russian | ru | ru-RU |
| Simplified Chinese | zh-CN | |
| Spanish | es | es-ES |
| Swedish | sv | sv-SE |
| Traditional Chinese | zh-TW | |
| Turkish | tr | tr-TR |
override-properties___json
Requires preview="true" on analytics/chart. Overrides are applied as patches to the
object model at render time and do not permanently modify the object in the Qlik app.
This is the modern equivalent of the
Capability API setOptions() method.
It exposes the full nebula.js property schema for the chart
type, giving you access to any property the chart supports.
<qlik-embed ui="analytics/chart" app-id="<APP_ID>" object-id="<OBJECT_ID>" preview="true" override-properties___json="{title:'My new title'}"></qlik-embed>When you apply override properties:
- Any previous patches to that object are cleared first
- The new patches are then applied
- An empty object (
{}) clears all patches without applying new ones - Omitting override properties leaves existing patches unchanged
Patches affect all instances of the same object for the current user session.
Discovering overridable properties
The properties available to override depend on the chart type. Each nebula.js chart documents
its full property schema in its API reference on Qlik Developer. For example, the
bar chart JavaScript API covers properties
such as title, subtitle, orientation, color, legend, and more.
To find properties for other chart types, browse the
chart API references on Qlik Developer. Each chart’s npm
package (for example @nebula.js/sn-bar-chart)
also includes an api-specifications/properties.json file with the full machine-readable schema.
preview
If set to true, this parameter enables preview mode for analytics/sheet and analytics/chart.
This is an experimental version of these UIs which brings improvements such as:
- Support for non-Nebula charts (legacy charts such as the Text and Image object)
- Improved theme support to match the native Qlik Sense client
- Support for visualization extensions
- Context menu support for features such as exploration view, object download, and view data
The PDF preview in the download dialog will only display when using HTTPS protocol.
When preview is false or omitted, the analytics/sheet and analytics/chart
operate in their default mode.
Refer to the changelog for updates on this experience.
Usage:
Example to enable preview mode:
<qlik-embed ... preview="true"></qlik-embed> theme
If the name of a theme is provided for theme, then that theme will be applied
to the Qlik Sense app in place of the default or configured theme.
The use of custom theme overrides is not supported for Qlik Sense Enterprise client-managed.
Usage:
Example to set the theme to the built-in Breeze theme, named breeze:
<qlik-embed ... theme="breeze"></qlik-embed>Helper tags
In addition to the <qlik-embed> UI tag, you can use helper tags to provide additional
configuration that applies to all qlik-embed tags.
These tags should be placed in the same document as the qlik-embed tags, and will be interpreted by the qlik-embed framework prior to rendering of UIs.
qlik-initial-selections
The qlik-initial-selections tag allows you to set initial selections in the
specified Qlik Sense app before any UI is rendered.
qlik-initial-selections sets state on the app session, not on an individual embedded object.
Every qlik-embed element connected to the same app and identity will reflect these
selections. If you need isolated selection state per object, either assign a unique identity
to each group of objects, use alternate states in the app, or use the
ref API for programmatic control.
Basic syntax
Attributes on <qlik-initial-selections>:
app-id: The ID of the Qlik Sense app.bookmark-id: Apply a bookmark to the app state instead of (or before) field selections.clear-all: Boolean. Clears all existing selections in the app before applying new ones.
Attributes on each <field> child:
name: The field name to select in. Master dimensions are not supported.values: A semicolon-delimited list of values to select.state: The alternate state to apply the selections to. If omitted, uses the default state.
Example:
<qlik-initial-selections app-id="<APP_ID>" clear-all> <field name="<FIELD_NAME>" values="<VALUE_1>;<VALUE_2>"></field> <field state="<STATE_NAME>" name="<FIELD_NAME>" values="<VALUE_1>;<VALUE_2>"></field></qlik-initial-selections>Apply a bookmark:
<qlik-initial-selections app-id="<APP_ID>" bookmark-id="<BOOKMARK_ID>"></qlik-initial-selections>With actual values:
<qlik-initial-selections app-id="a51a902d-76a9-4c53-85d2-066b44240146"> <field state="comparison" name="Product Sub Group Desc" values="Hot Dogs;Fresh Fruit"></field> <field state="comparison" name="AccountDesc" values="Sales;Cost of goods sold"></field></qlik-initial-selections>