Build a HelloWorld extension using nebula.js
In this tutorial you’ll learn how to build a simple extension that renders
a table using nebula.js.
It includes the following steps:
- Create a project
- Configure data structure
- Render data
- Select data
- Build and upload extension
Note: To upload the extension to Qlik Cloud you need access to a Qlik Cloud Analytics tenant, and either tenant administrator rights yourself, or the means to get an API key generated for you.
Requirements
This tutorial requires you to have the following accessible:
- Node.js (version 18 or newer)
- A terminal (for example Git Bash on Windows, or Terminal.app on Mac)
- A modern web browser, for example Google Chrome
- A text editor or IDE of your choice, for example Visual Studio Code
- An existing web integration, or possibility to get one created in your tenant
Create a project
The quickest way to get started is to use the nebula.js CLI:
npx @nebula.js/cli create hello --picasso noneThe --picasso none option tells the command to not create a
picasso visualization template, other options are minimal and barchart.
The command scaffolds a project into the /hello folder with the following
structure:
/srcdata.js- Data configurationext.js- Extension settingsindex.js- Main entry point of this visualizationmeta.json- Metadata for the extensionobject-properties.js- Default object properties
/test- Integration testspackage.json
The folder contains some additional dotfiles that provides linting and formatting of code.
Start the development server
Start the development server with:
cd hellonpm run startThe command starts a local development server and opens up
http://localhost:8080 in your browser.
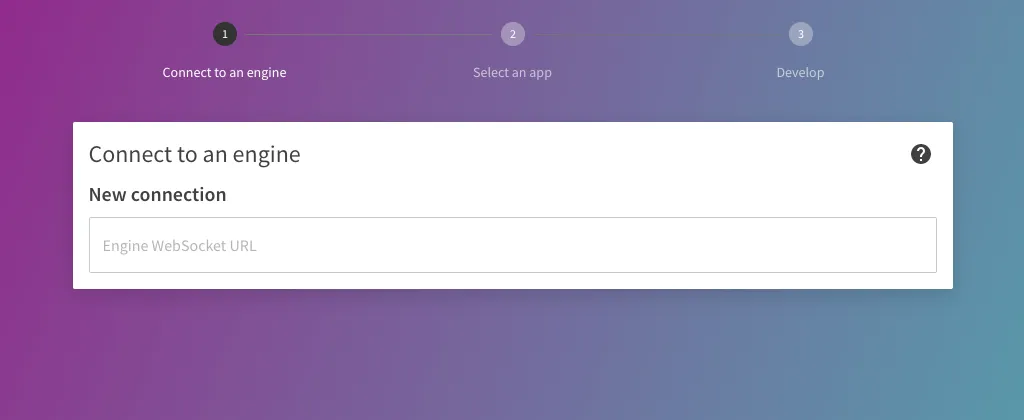
The development server needs to connect to a Qlik Associative Engine running in any Qlik deployment. Enter the WebSocket URL that corresponds to the Qlik product you are using.
For more information on connecting to various deployments, see the nebula CLI documentation.
Next, select an app to connect to.
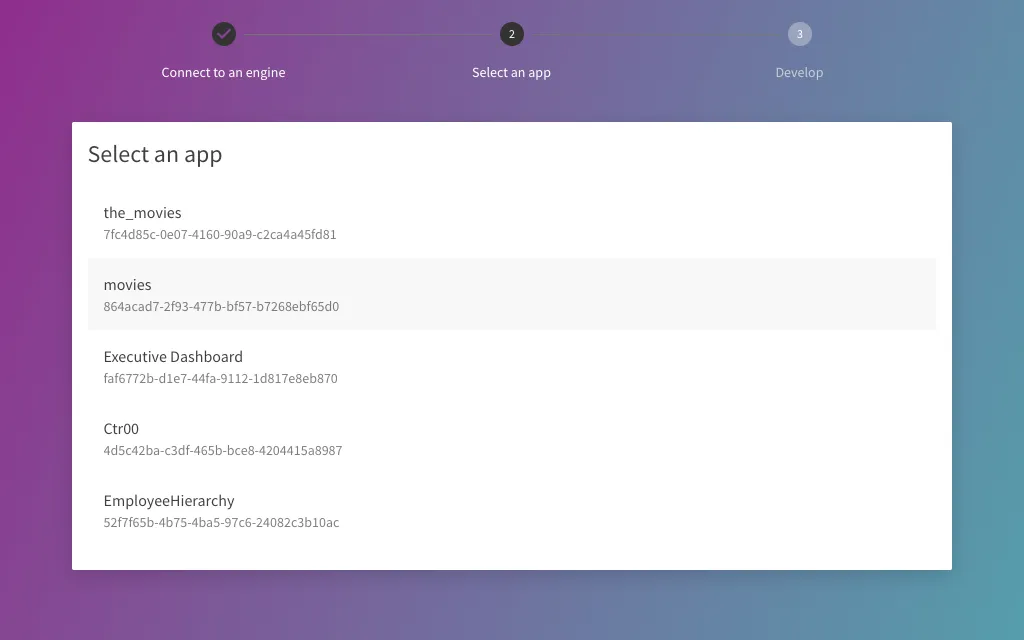
You are then redirected to the main developer UI where you can see your visualization rendered:
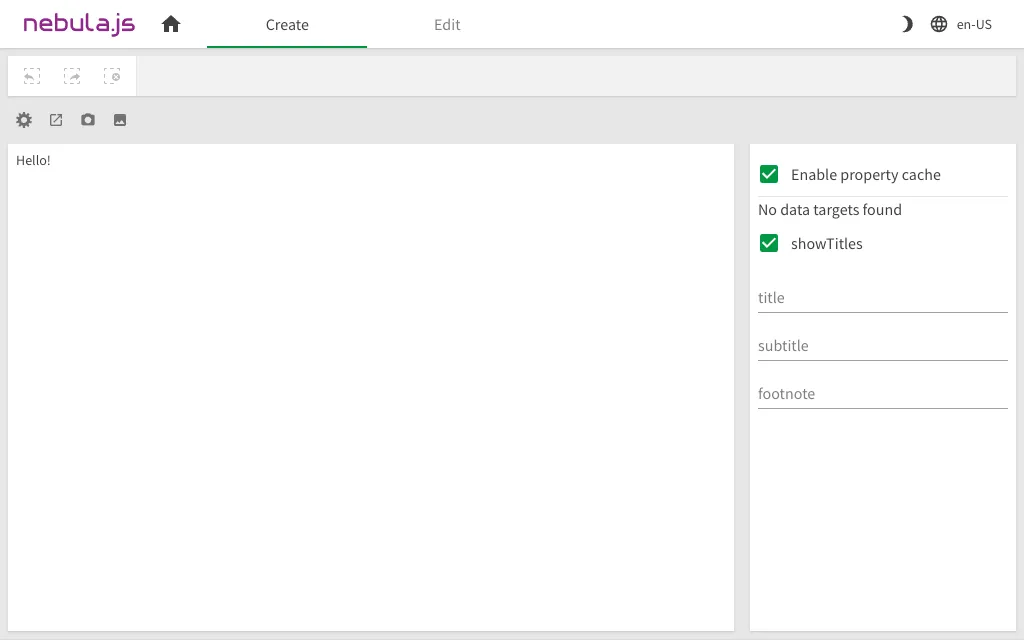
Any updates in /src/index.js that affects the output automatically causes a
refresh of the visualization and you can see the changes immediately.
Note: If the changes do not appear, try running
nebula buildin a new terminal and refresh the browser.
Configure data structure
A simple Hello message isn’t really that useful, time to add some data.
Add a qHyperCubeDef definition in object-properties.js:
const properties = { qHyperCubeDef: { qInitialDataFetch: [{ qWidth: 2, qHeight: 10 }], }, // ...};Then add /qHyperCubeDef as a data target in data.js:
export default { targets: [ { path: "/qHyperCubeDef", }, ],};With only those changes you should now have the option to add data from the property panel on the right:
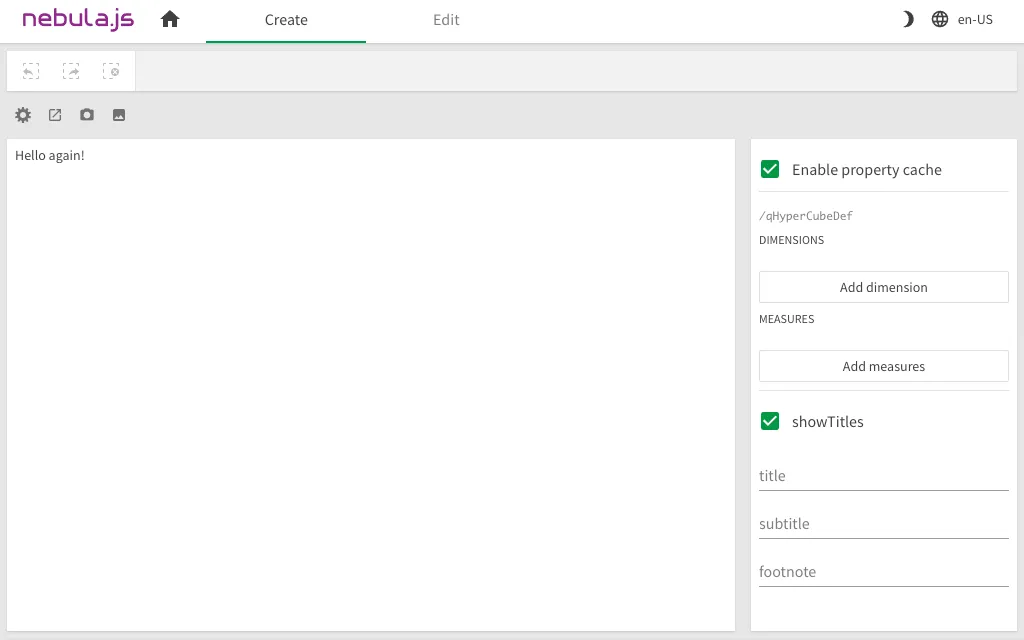
Add a dimension by clicking on Add dimension and selecting a value in the menu that appears, do the same with measure.
Render data
In order to render the data you first need to access it through the useLayout hook:
import { useLayout, useElement, useEffect } from '@nebula.js/stardust';
// ...component() {  console.log(useLayout());}
You can then useLayout in combination with useEffect to render the headers and
rows of data in qHyperCube:
component() {  const element = useElement();  const layout = useLayout();
  useEffect(() => {    if (layout.qSelectionInfo.qInSelections) {      // skip rendering when in selection mode      return;    }    const hc = layout.qHyperCube;
    // headers    const columns = [...hc.qDimensionInfo, ...hc.qMeasureInfo].map((f) => f.qFallbackTitle);    const header = `<thead><tr>${columns.map((c) => `<th>${c}</th>`).join('')}</tr></thead>`;
    // rows    const rows = hc.qDataPages[0].qMatrix      .map((row) => `<tr>${row.map((cell) => `<td>${cell.qText}</td>`).join('')}</tr>`)      .join('');
    // table    const table = `<table>${header}<tbody>${rows}</tbody></table>`;
    // output    element.innerHTML = table;
  }, [element, layout])}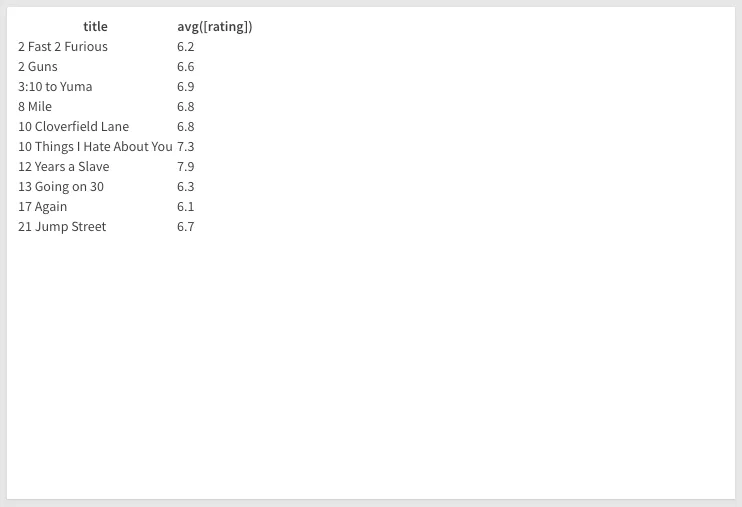
Select data
Before selecting data, meta data on each row needs to be added so that the values can be identified for selection:
// rowsconst rows = hc.qDataPages[0].qMatrix .map( (row, rowIdx) => `<tr data-row="${rowIdx}"> ${row.map((cell) => `<td>${cell.qText}</td>`).join("")} </tr>` ) .join("");And then add a 'click' event handler on element which does the following:
- Verifies that the clicked element is a
td - Begins selections in
/qHyperCubeDefif not already activated - Extracts the
data-rowindex fromtr - Updates
selectedRowsbased on the clickdata-row
const element = useElement();const selections = useSelections();const [selectedRows, setSelectedRows] = useState([]);
useEffect(() => {  const listener = (e) => {    if (e.target.tagName === "TD") {      if (!selections.isActive()) {        selections.begin("/qHyperCubeDef");      }      const row = +e.target.parentElement.getAttribute("data-row");      setSelectedRows((prev) => {        if (prev.includes(row)) {          return prev.filter((v) => v !== row);        }        return [...prev, row];      });    }  };
  element.addEventListener("click", listener);
  return () => {    element.removeEventListener("click", listener);  };}, [element]);
Next, update the styling of the selected rows in the table whenever they change:
useEffect(() => { if (!layout.qSelectionInfo.qInSelections) { // no need to update when not in selection mode return; } element.querySelectorAll("tbody tr").forEach((tr) => { const idx = +tr.getAttribute("data-row"); tr.style.backgroundColor = selectedRows.includes(idx) ? "#eee" : ""; });}, [element, selectedRows, layout]);Finally, apply the selected values through the selections API:
useEffect(() => { if (selections.isActive()) { if (selectedRows.length) { selections.select({ method: "selectHyperCubeCells", params: ["/qHyperCubeDef", selectedRows, []], }); } else { selections.select({ method: "resetMadeSelections", params: [], }); } } else if (selectedRows.length) { setSelectedRows([]); }}, [selections.isActive(), selectedRows]);Build and upload extension
You have so far been working in a local isolated environment on a chart that’s not dependant on any specific Qlik product.
The command:
npm run buildgenerates a bundle into the /dist folder which is all you need to distribute
the chart as an npm package.
Qlik Sense however requires some additional files and slightly different format to interpret the chart as an extension. To generate these files you can run the command:
npm run senseThe command generates all files into the folder /hello-ext, which you then
can use as an extension in your choice of Qlik Sense.
To upload the extension to your Qlik Cloud tenant, follow the instructions on managing extensions.