Creating waterfall charts
Where possible, use qlik-embed and qlik/api rather than this framework.
The waterfall chart is suitable for illustrating how an initial value is affected by intermediate positive and negative values. The starting and the final values are represented by whole bars, and intermediate values by floating bars. You can also show subtotals in the chart. In a waterfall chart you need to use one measure for each bar in the chart. The order of the measures defines the order of the bars in the chart. For each measure, you need to define how it affects the previous value. You can add up to 30 measures in a waterfall chart.
You can use the Measure operation
option (Add/Subtract/Subtotals) of each measure
to set how it affects the previous value
by setting valueType property to NORMAL/INVERSE/SUBTOTAL.
- Add. The measure value adds to the previous bar.
If this is the first measure,
a whole bar is shown starting at 0. Setting
valueTypetoNORMAL. - Subtract. The measure value subtracts from the previous bar.
Setting
valueTypetoINVERSE. - Subtotals. The measure value is considered a subtotal. Setting
valueTypetoSUBTOTAL.
Learn more about the waterfall chart, or review the waterfall chart API specification.

// 'app' is an enigma app modelconst embeddable = embed(app, {  types: [    {      // register waterfall chart      name: "waterfall",      load: () => Promise.resolve(waterfall),    },  ],});
embeddable.render({  element,  type: "waterfall",  fields: [],  // overrides default properties  properties: {    qHyperCubeDef: {      qMeasures: [        {          qDef: {            qDef: "Sum(Sales)",            valueType: "NORMAL",            subtotal: {              enable: false,              label: "Subtotals",            },          },        },        {          qDef: {            qDef: "Sum(Cost)",            valueType: "INVERSE",            subtotal: {              enable: true,              label: "Sales margin",            },          },        },      ],      qInitialDataFetch: [        {          qLeft: 0,          qTop: 0,          qWidth: 200,          qHeight: 10,        },      ],    },  },});
Requirements
Requires @nebula.js/stardust version 1.4.0 or later.
Installing
If you use npm: npm install @nebula.js/sn-waterfall.
You can also load through the script tag directly from
https://unpkg.com.
More examples
Colors
You can set the presentation color for the different measure operations: Positive value color, Negative value color or Subtotal color
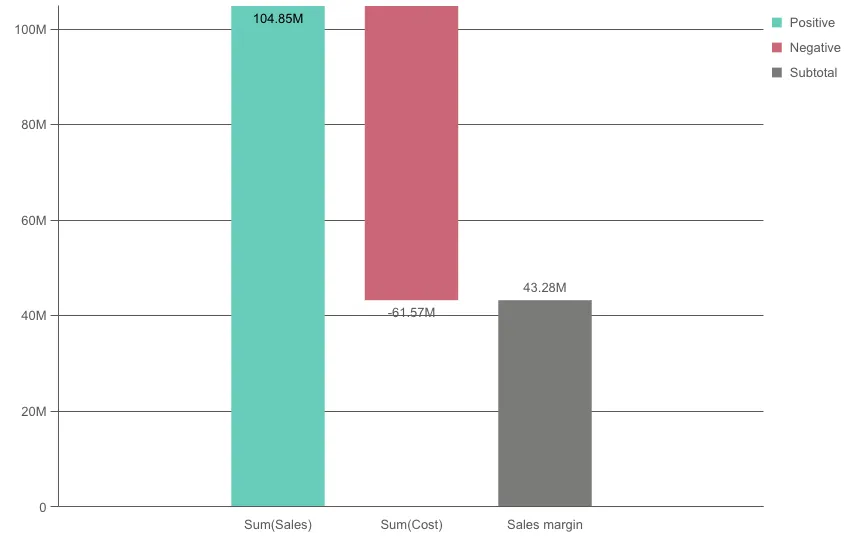
embeddable.render({ element, type: "waterfall", fields: [], // overrides default properties properties: { qHyperCubeDef: { qMeasures: [ { qDef: { qDef: "Sum(Sales)", valueType: "NORMAL", subtotal: { enable: false, label: "Subtotals", }, }, }, { qDef: { qDef: "Sum(Cost)", valueType: "INVERSE", subtotal: { enable: true, label: "Sales margin", }, }, }, ], qInitialDataFetch: [ { qLeft: 0, qTop: 0, qWidth: 200, qHeight: 10, }, ], }, color: { auto: false, positiveValue: { paletteColor: { index: -1, color: "#66CCBB", }, }, negativeValue: { paletteColor: { index: -1, color: "#cc6677", }, }, subtotal: { paletteColor: { index: -1, color: "#7b7a78", }, }, }, },});