Creating pivot tables
Where possible, use qlik-embed and qlik/api rather than this framework.
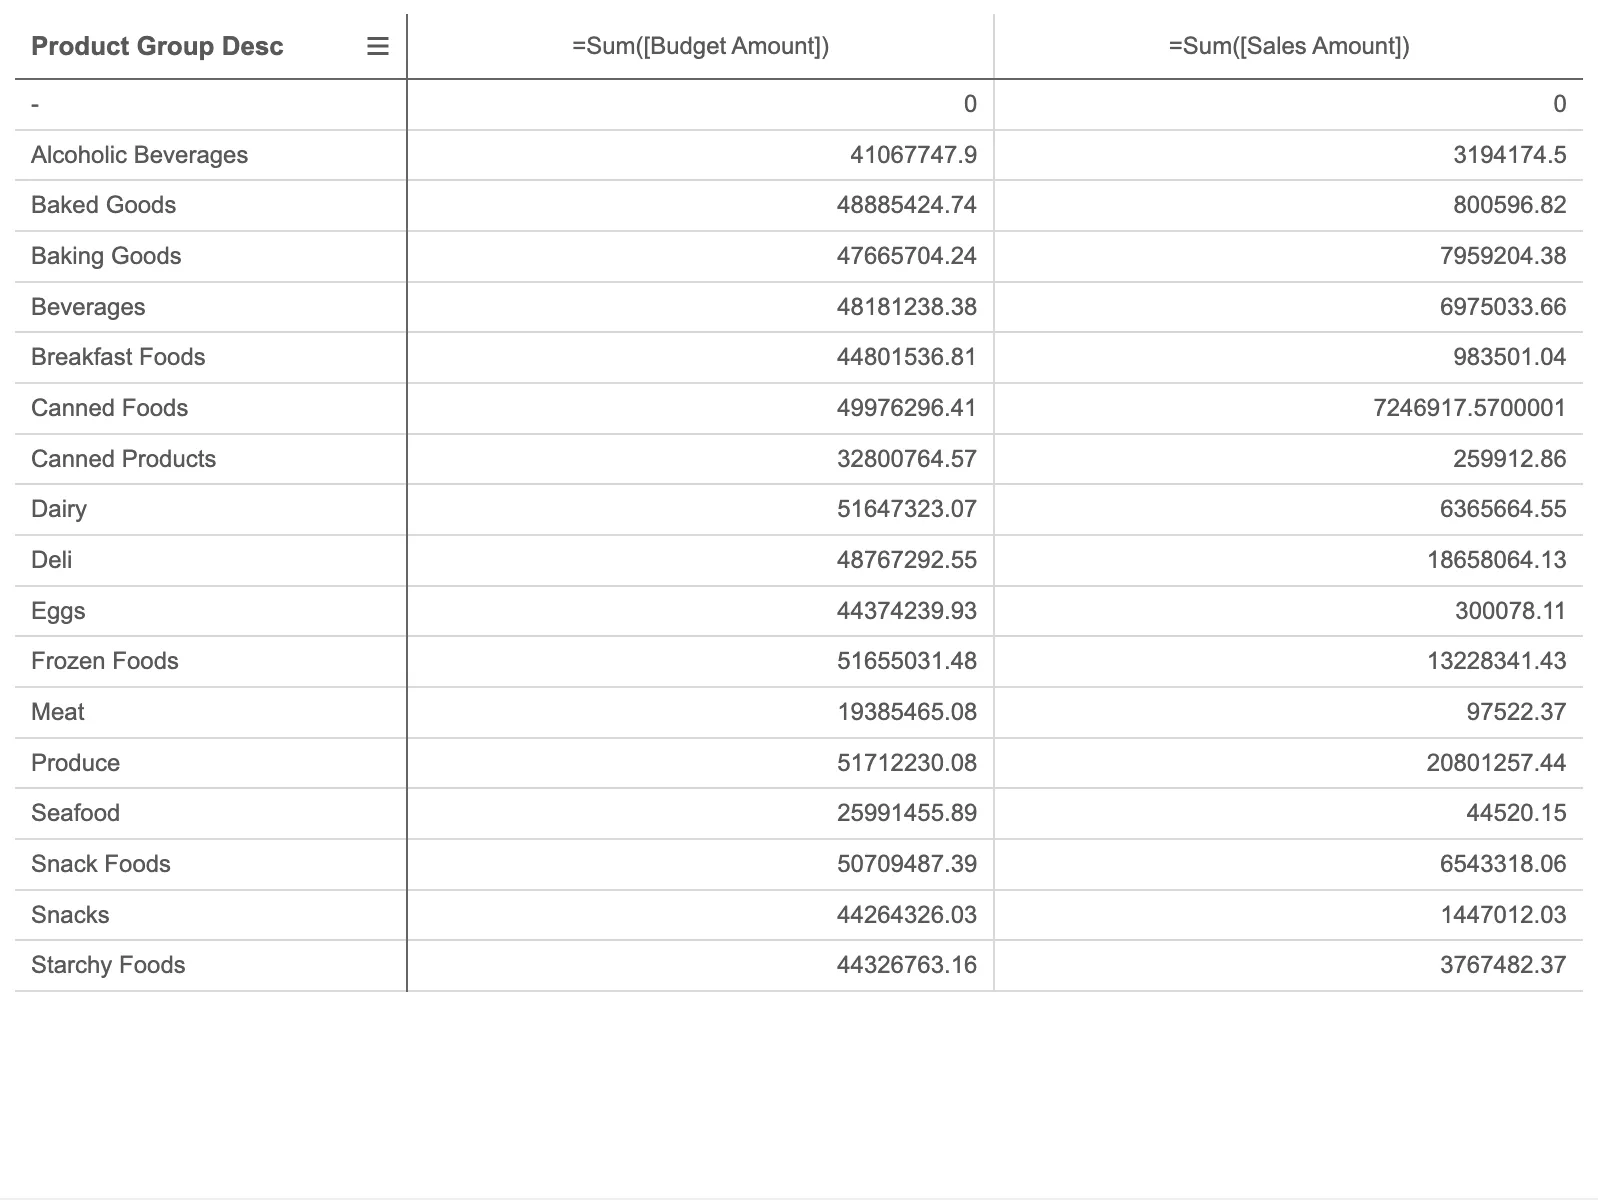
The pivot table presents dimensions and measures as rows and columns in a table. In a pivot table you can analyze data by multiple measures and in multiple dimensions at the same time.
Learn more about the pivot chart, or review the pivot chart API specification.
// Configure nucleusconst n = window.stardust.embed(app, {  types: [    {      name: "pivot-table",      load: () => Promise.resolve(window["sn-pivot-table"]),    },  ],});
// Rendering a pivot tablen.render({  type: "pivot-table",  element: document.querySelector(".object"),  fields: [    "Product Group Desc",    "=Sum([Budget Amount])",    "=Sum([Sales Amount])",  ],});
More examples
You can customize the pivot table. Here are some basic examples.
Pivoting data
When you want to rearrange your data you can set properties that defines if a dimension should be positioned as a row or a column.
This is done using the qNoOfLeftDims property. It specifies how many
of the dimensions that should be rows.

n.render({ type: "pivot-table", element: document.querySelector(".object"), fields: ["Product Group Desc", "Region Name", "=Sum([Sales Amount])"], properties: { qHyperCubeDef: { qMode: "P", qNoOfLeftDims: 1, }, },});Measure grouping
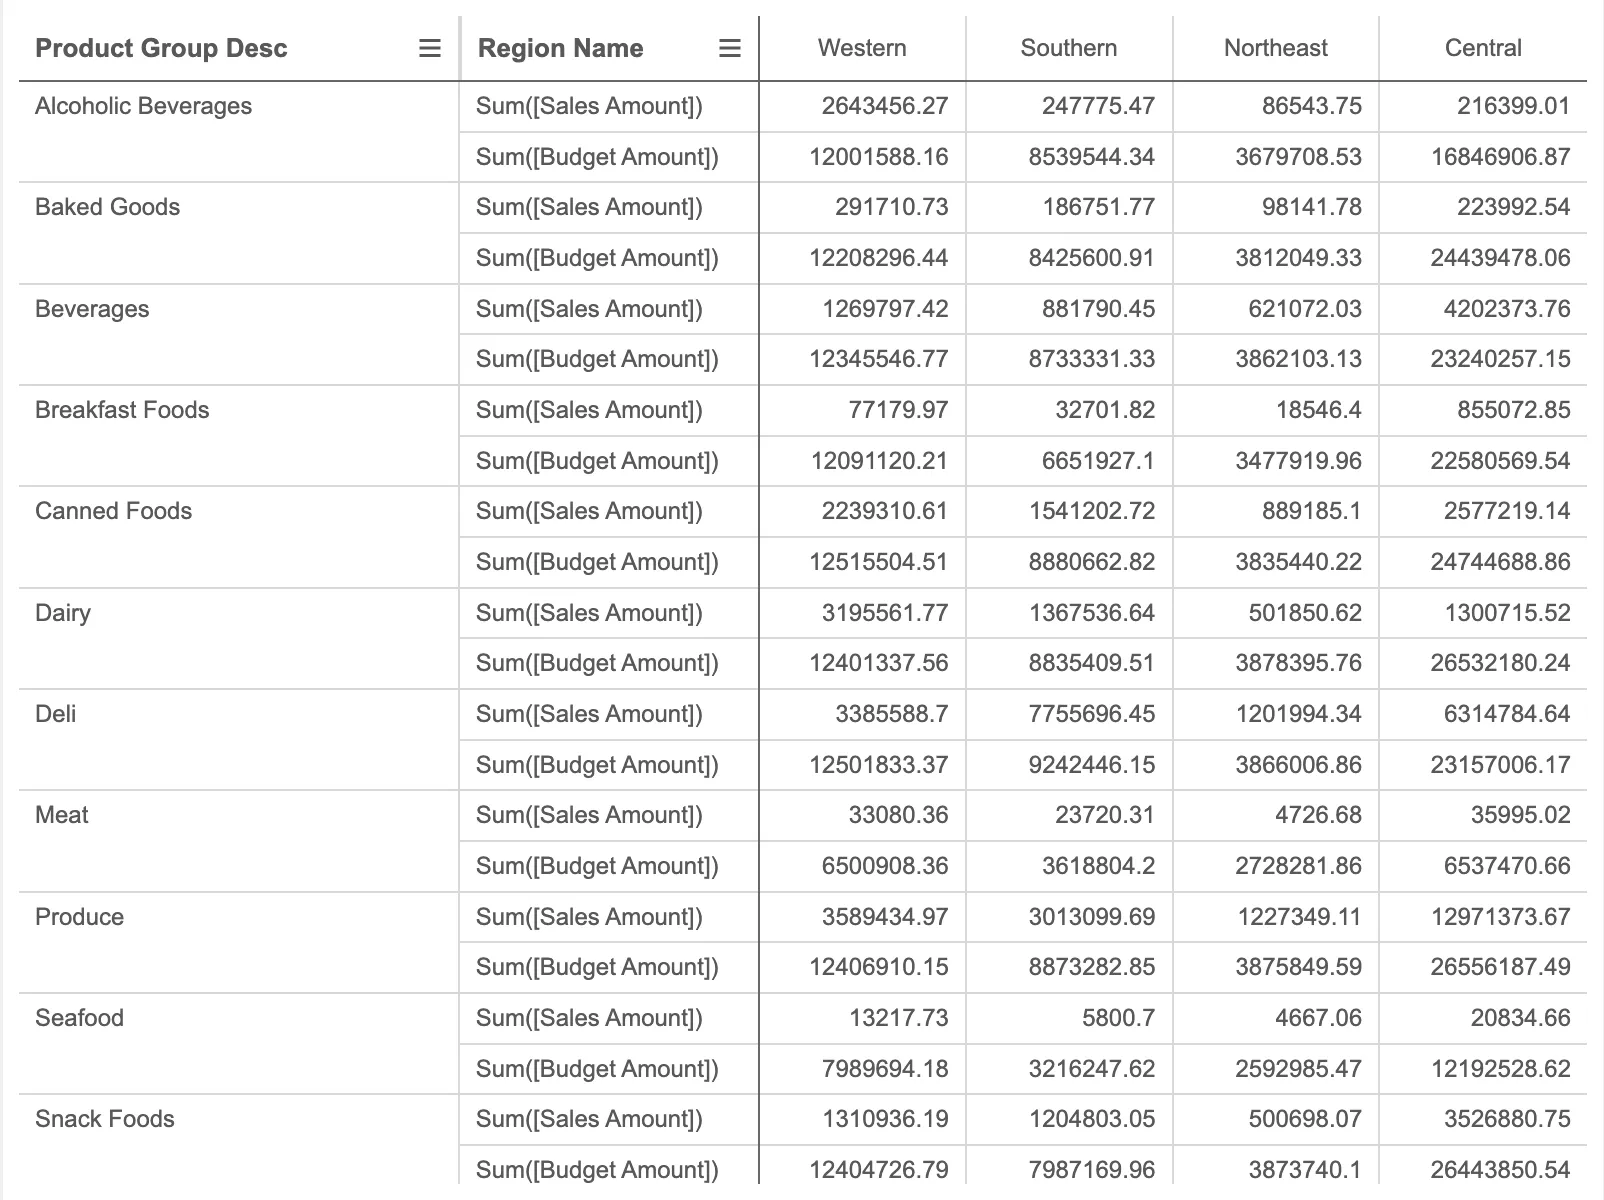
Multiple measures in the pivot table are always grouped together. This group of measures can be pivoted just like dimensions and positioned either as a row or a column.
To pivot the measure group use the qInterColumnSortOrder and position
the -1 value. Note that qNoOfLeftDims defines if the measure group
is positioned as a row or a column. Also, when you want set more advanced settings,
the data needs to be defined in qHyperCubeDef, instead of the fields property.
n.render({ type: "pivot-table", element: document.querySelector(".object"), properties: { qHyperCubeDef: { qDimensions: [ { qDef: { qFieldDefs: ["Product Group Desc"], }, }, { qDef: { qFieldDefs: ["Region Name"], }, }, ], qMeasures: [ { qDef: { qDef: "Sum([Sales Amount])", }, }, { qDef: { qDef: "Sum([Budget Amount])", }, }, ], qMode: "P", qNoOfLeftDims: 2, qInterColumnSortOrder: [0, -1, 1], }, },});Column width
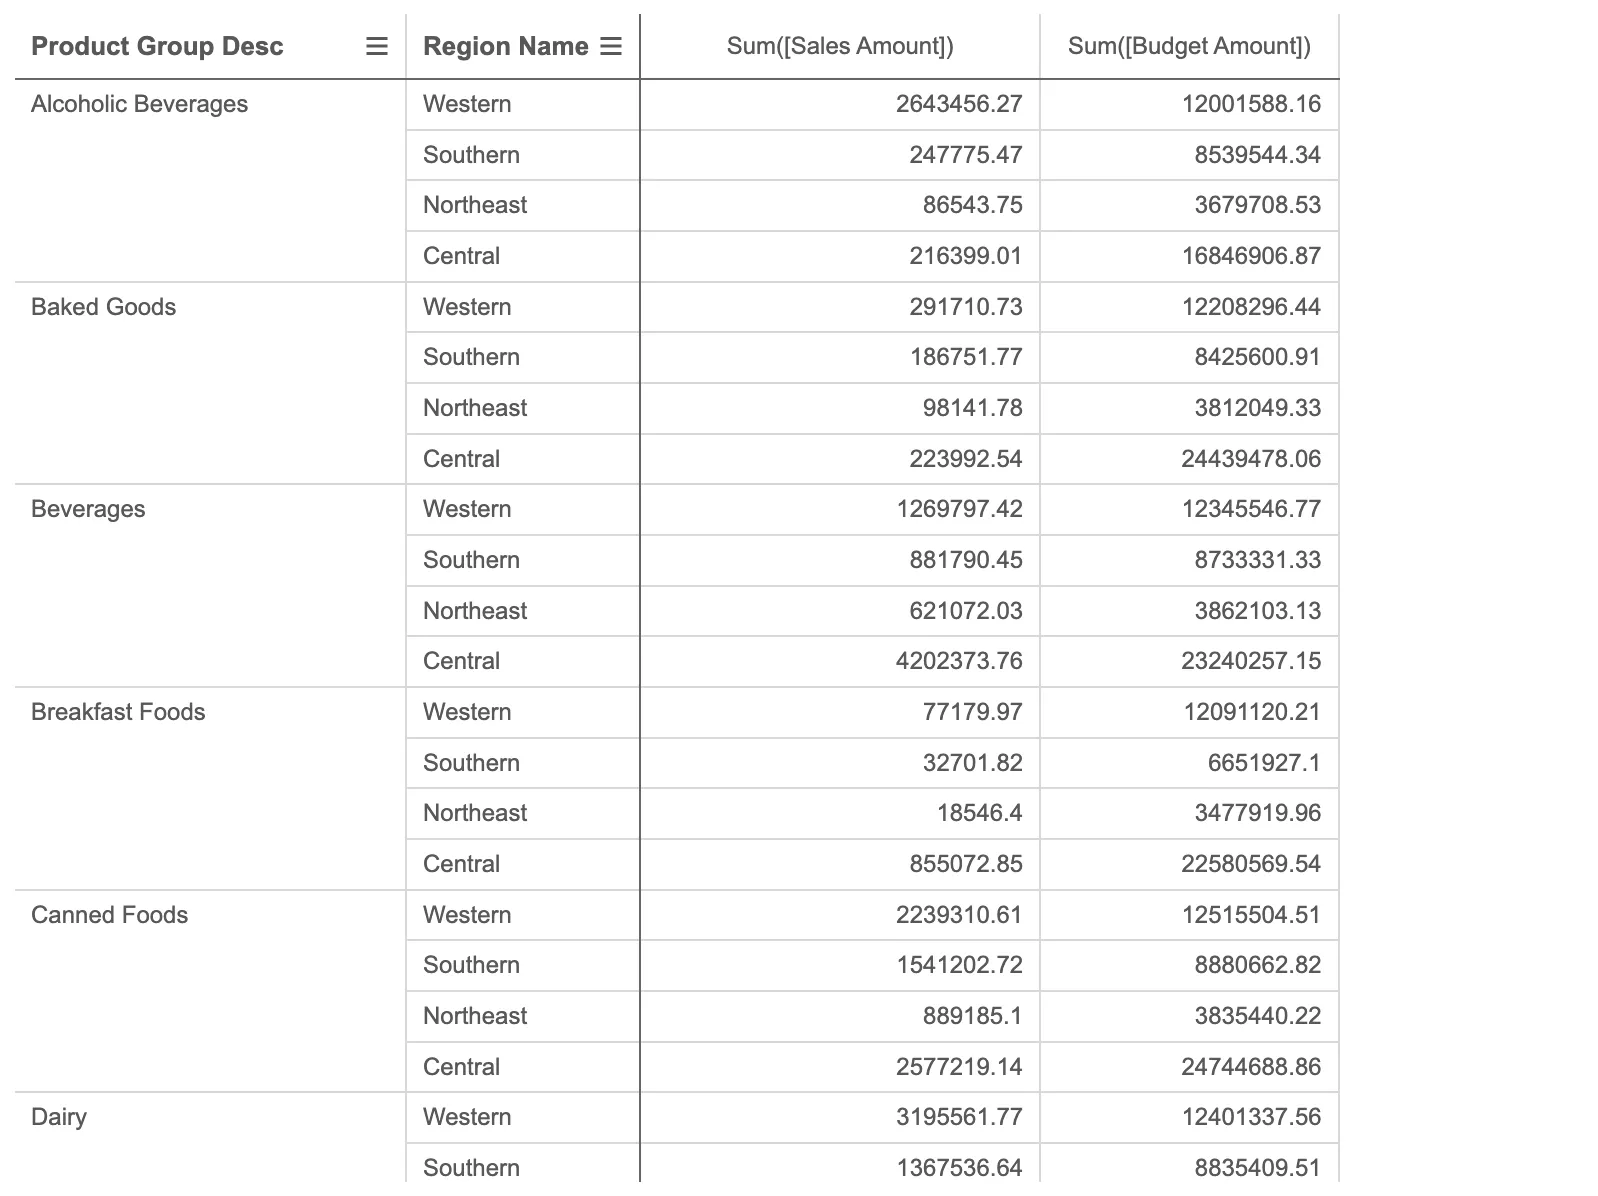
The column width can be defined in different ways:
auto(default) calculates the column width so that the total pivot table width equals the chart width (for rows,autoit is the same asfitToContent).fitToContentcalculates a width based on the cells’ content.pixelsuses a specified pixel value.percentagesets the column width to the specified percentage of the chart width (for columns, it is the percentage of the chart width minus the total width of rows).
The setting is applied to each field.
n.render({ type: "pivot-table", element: document.querySelector(".object"), properties: { qHyperCubeDef: { qDimensions: [ { qDef: { qFieldDefs: ["Product Group Desc"], columnWidth: { type: "percentage", percentage: 25, }, }, }, { qDef: { qFieldDefs: ["Region Name"], }, }, ], qMeasures: [ { qDef: { qDef: "Sum([Sales Amount])", columnWidth: { type: "pixels", pixels: 200, }, }, }, { qDef: { qDef: "Sum([Budget Amount])", columnWidth: { type: "fitToContent", }, }, }, ], qMode: "P", qAlwaysFullyExpanded: true, }, },});Styling
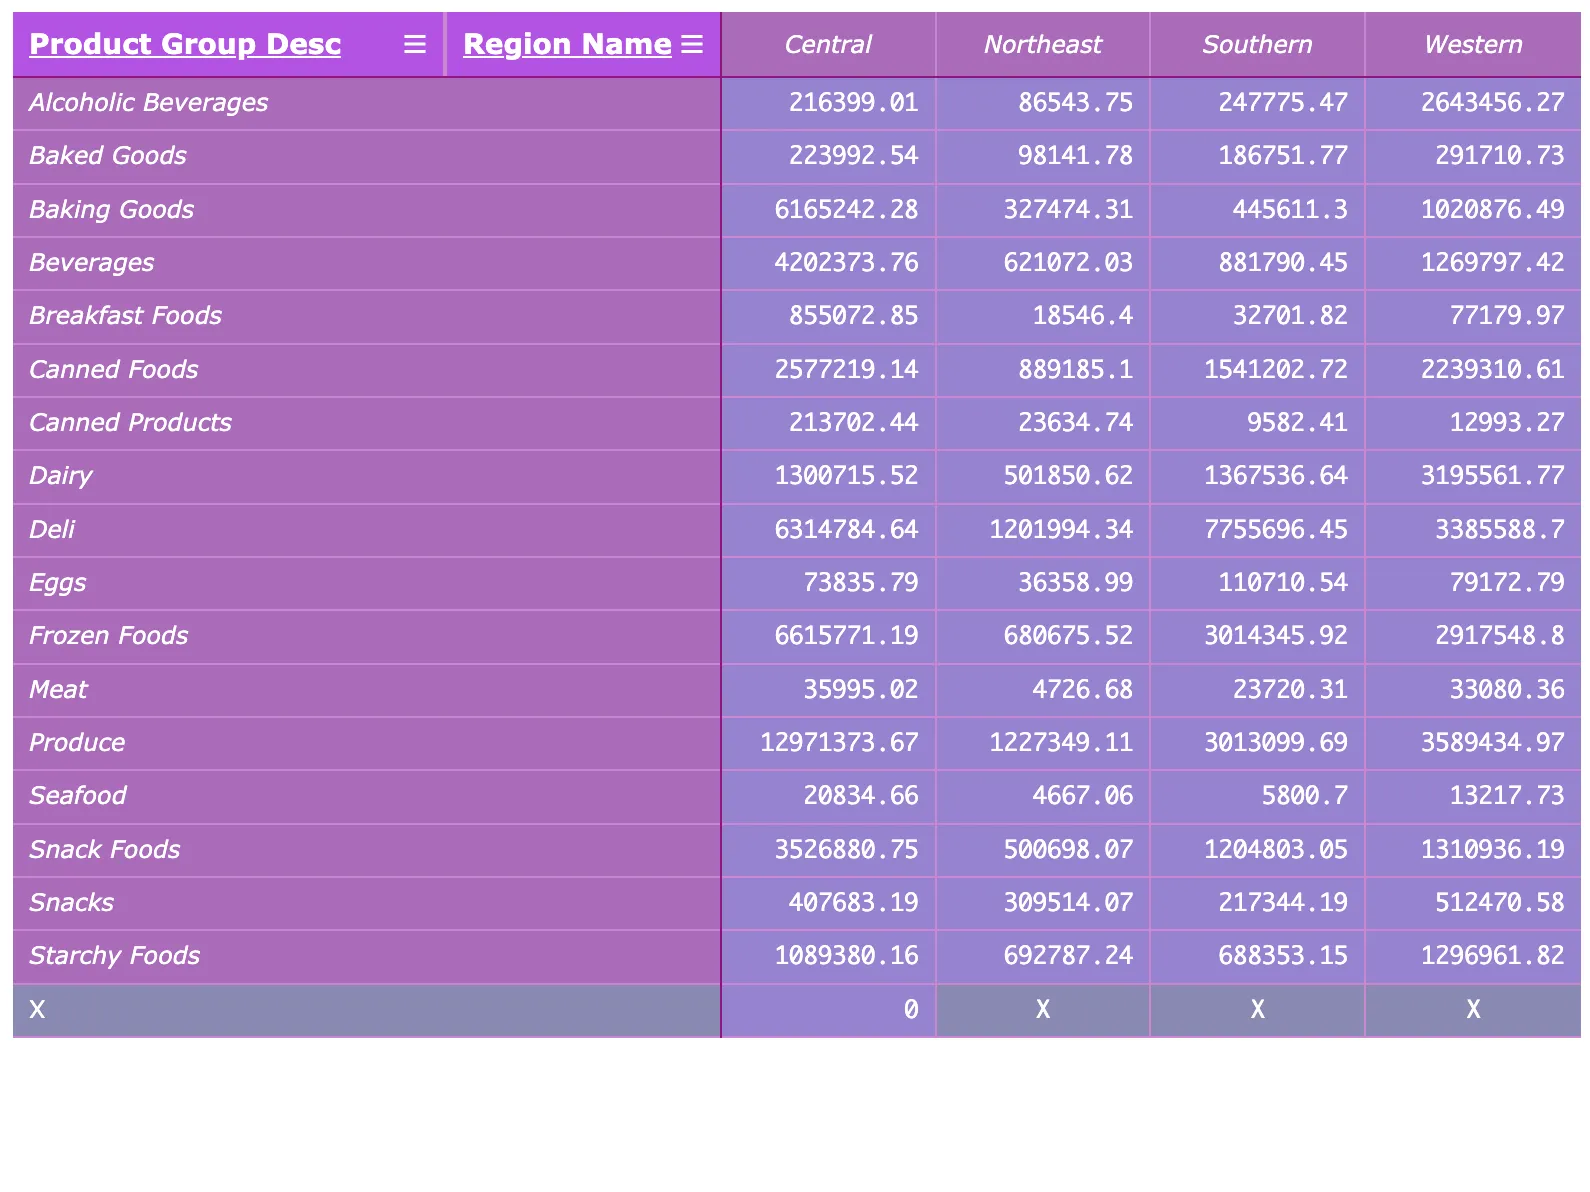
The pivot table can be extensively styled. The headers, dimension values, measure values and measure labels can styled by setting font family, font size, font color and background color. In addition, the border color and height (in number of lines) can be set for all cells. The null value text can also be set.
n.render({ type: "pivot-table", element: document.querySelector(".object"), fields: ["Product Group Desc", "Region Name", "=Sum([Sales Amount])"], properties: { qHyperCubeDef: { qMode: "P", qNoOfLeftDims: 1, }, components: [ { key: "theme", header: { background: { color: "#b353e3" }, fontColor: { color: "#ffffff" }, fontFamily: "Verdana, sans-serif", fontSize: "14px", fontStyle: ["bold", "underline"], }, dimensionValues: { background: { color: "#a96bba" }, fontColor: { color: "#ffffff" }, fontFamily: "Verdana, sans-serif", fontSize: "14px", fontStyle: ["italic"], }, measureValues: { background: { color: "#9783d1" }, fontColor: { color: "#ffffff" }, fontFamily: "Monaco, monospace", }, measureLabels: { background: { color: "#a96bba" }, fontColor: { color: "#ffffff" }, fontStyle: ["italic"], }, nullValues: { background: { color: "#8a89b3" }, fontColor: { color: "#ffffff" }, }, grid: { background: { color: "#9783d1" }, border: { color: "#c986d1" }, divider: { color: "#8f1680" }, }, }, ], nullValueRepresentation: { text: "X", }, },});Measure and dimension specific Styling
The value cells of either a measure or dimension can be styled with a specific background or font color. This is achieved through expressions, allowing the color to vary based on the cell’s value.
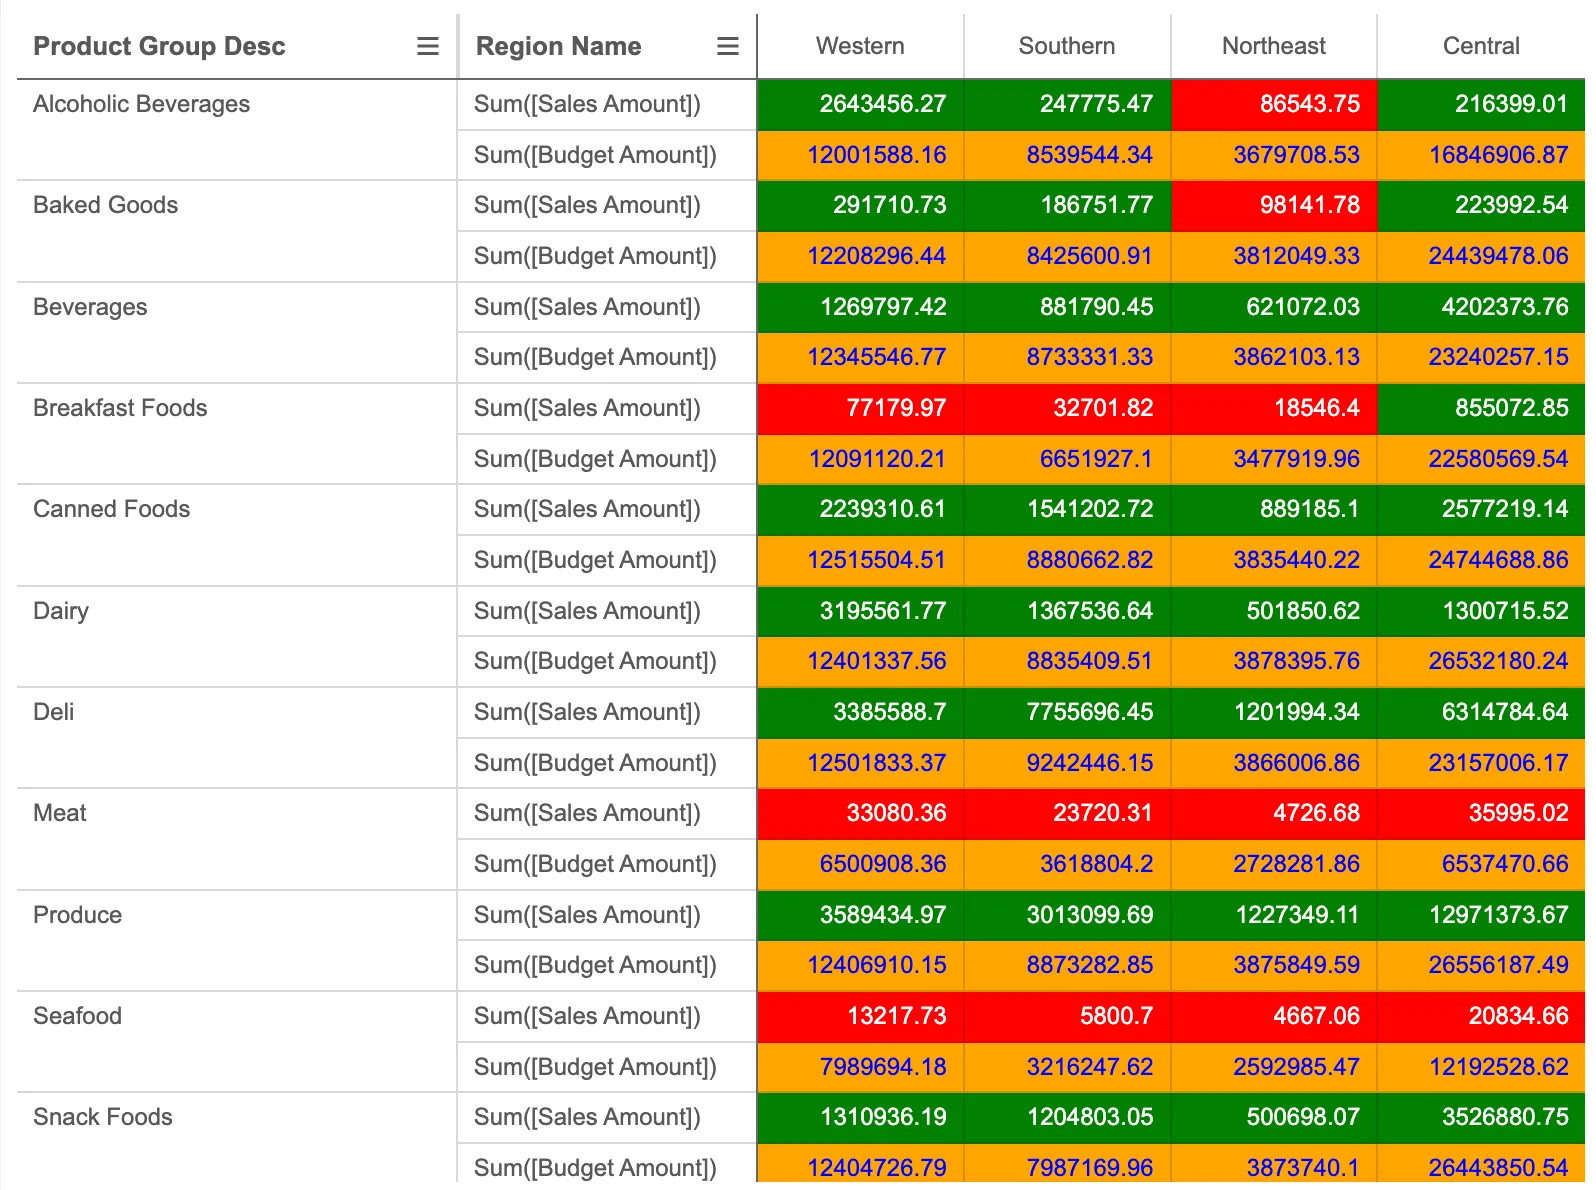
n.render({ type: "pivot-table", element: document.querySelector(".object"), properties: { qHyperCubeDef: { qDimensions: [ { qDef: { qFieldDefs: ["Product Group Desc"], }, }, { qDef: { qFieldDefs: ["Region Name"], }, }, ], qMeasures: [ { qDef: { qDef: "Sum([Sales Amount])", }, qAttributeExpressions: [ { qExpression: "if(Sum([Sales Amount]) < 100000, 'red', 'green')", id: "cellBackgroundColor", }, ], }, { qDef: { qDef: "Sum([Budget Amount])", }, qAttributeExpressions: [ { qExpression: "'orange'", id: "cellBackgroundColor", }, { qExpression: "'blue'", id: "cellForegroundColor", }, ], }, ], qMode: "P", qNoOfLeftDims: 2, qInterColumnSortOrder: [0, -1, 1], }, },});