Creating pie charts
Where possible, use qlik-embed and qlik/api rather than this framework.
A pie chart is a circular chart divided into more slices that each represent a proportion of the whole. Pie charts are most visually efficient when a small number (10 or fewer) of slices is displayed.
Learn more about the pie chart, or review the pie chart API specification.
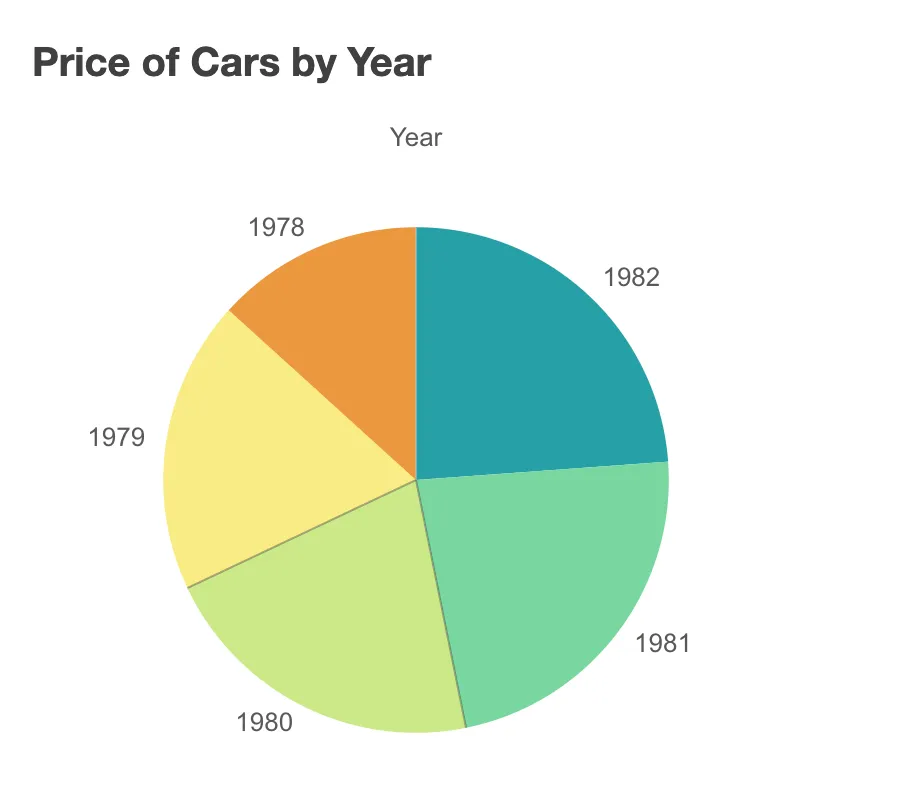
// Configure nucleusconst nuked = window.stardust.embed(app, {  context: { theme: "light" },  types: [    {      name: "pie-chart",      load: () => Promise.resolve(window["sn-pie-chart"]),    },  ],});// Rendering a pie chart on the flynuked.render({  element: document.querySelector(".pie"),  type: "pie-chart",  fields: ["Year", "=Avg(Price)"],
  // Overrides default properties  properties: {    title: "Price of Cars by Year",    dataPoint: {      labelMode: "none",    },  },});
In a pie chart you need at least one dimension and one measure. The dimension determines what kind of data is represented on the slices. The measure determines the angle of each slice. A second measure can be added, this one determines the radius of the slices.
Two types of pie chart views are available: the traditional pie chart and the hollow-centered donut chart.
Requirements
Requires @nebula.js/stardust version 1.2.0 or later.
Installing
If you use npm: npm install @nebula.js/sn-pie-chart.
You can also load through the script tag directly from
https://unpkg.com.
Examples
The examples below show some possible configurations for the pie chart.
One dimension, one measure, value labels
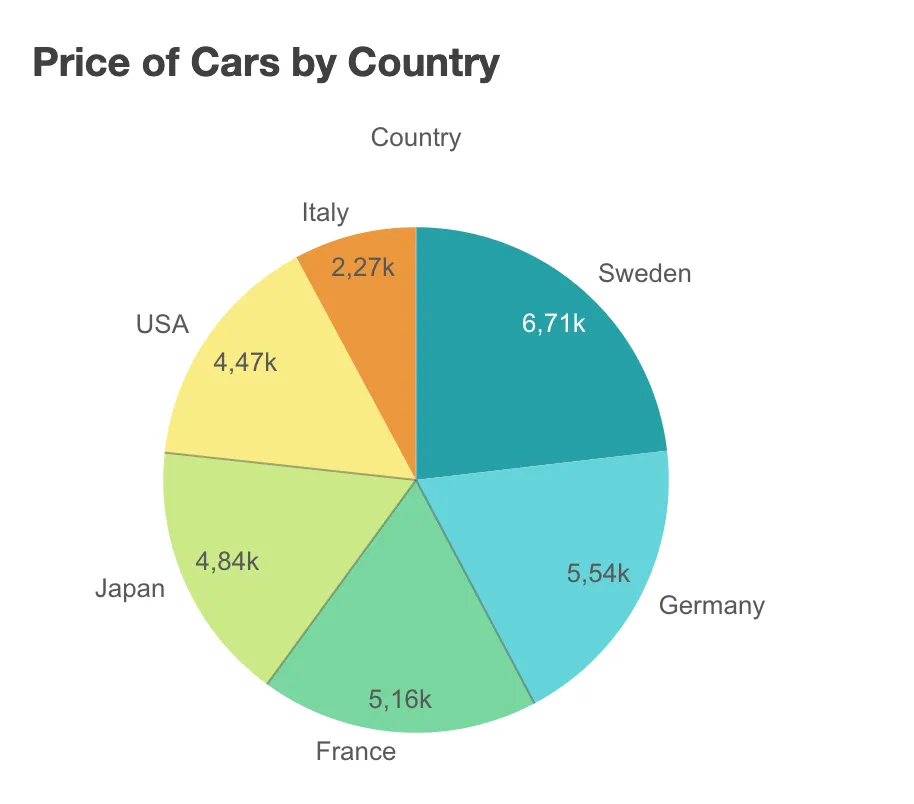
nuked.render({  element: document.querySelector(".pie"),  type: "pie-chart",  fields: ["Country", "=Avg(Price)"],
  // Overrides default properties  properties: {    title: "Price of Cars by Country",    dataPoint: {      labelMode: "value",    },  },});
One dimension, two measures, percentage labels
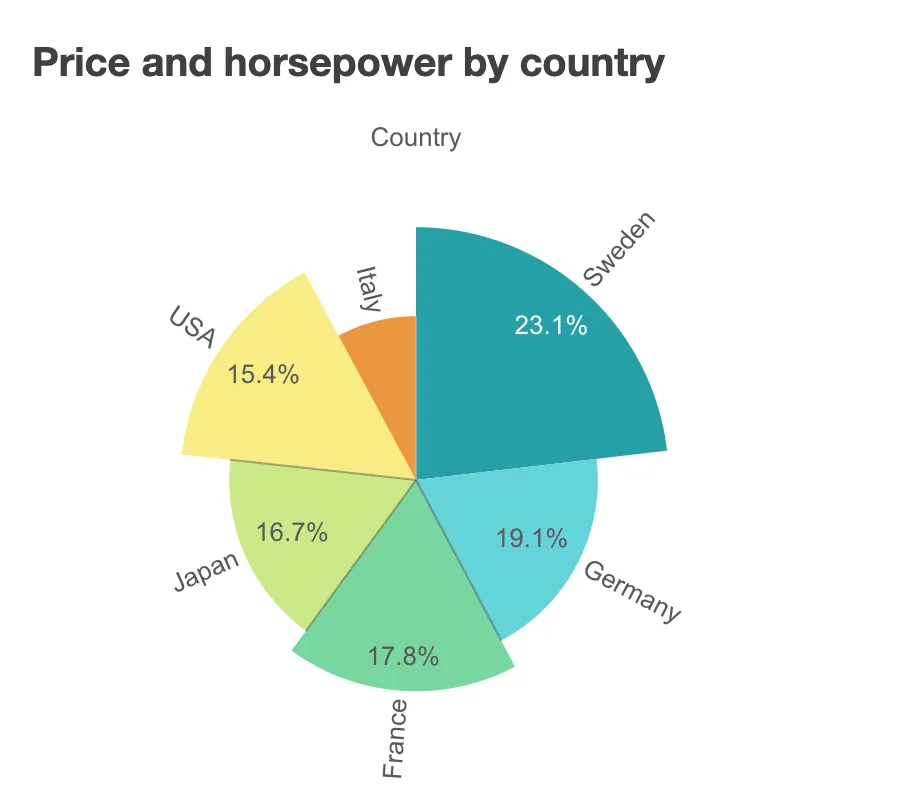
nuked.render({  element: document.querySelector(".pie"),  type: "pie-chart",  fields: ["Country", "=Avg(Price)", "=Avg(Horsepower)"],
  // Overrides default properties  properties: {    title: "Price and horsepower by country",    dataPoint: {      labelMode: "share",    },  },});
One dimension, one measure, donut chart view
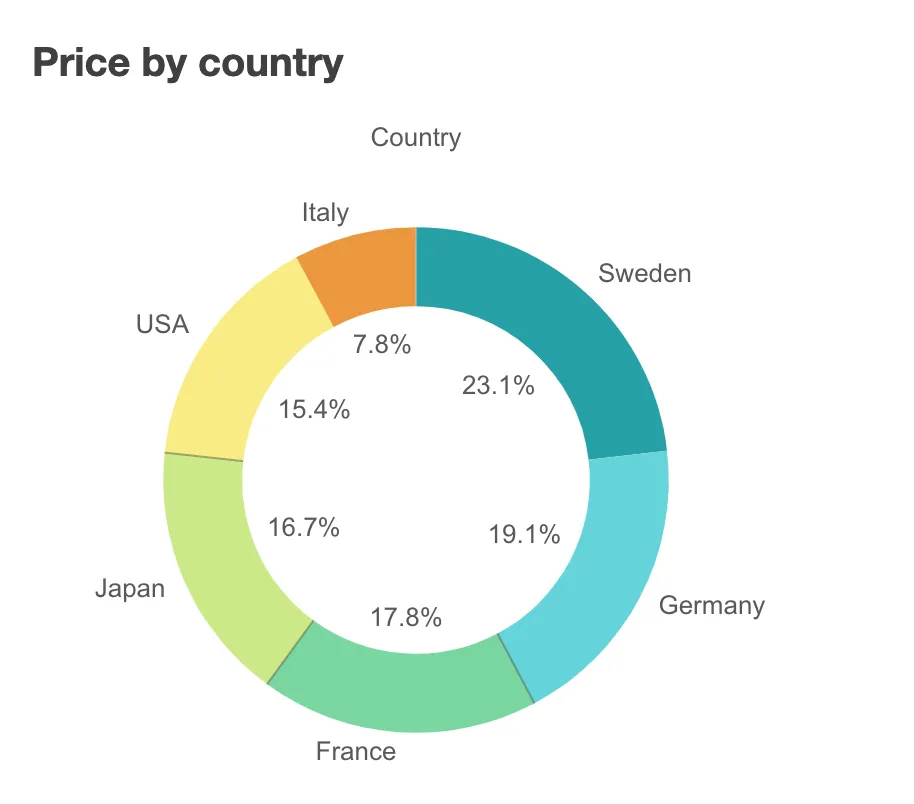
nuked.render({  element: document.querySelector(".pie"),  type: "pie-chart",  fields: ["Country", "=Avg(Price)"],
  // Overrides default properties  properties: {    title: "Price by country",    dataPoint: {      labelMode: "share",    },    donut: {      showAsDonut: true,    },  },});
One dimension, two measures, donut chart view
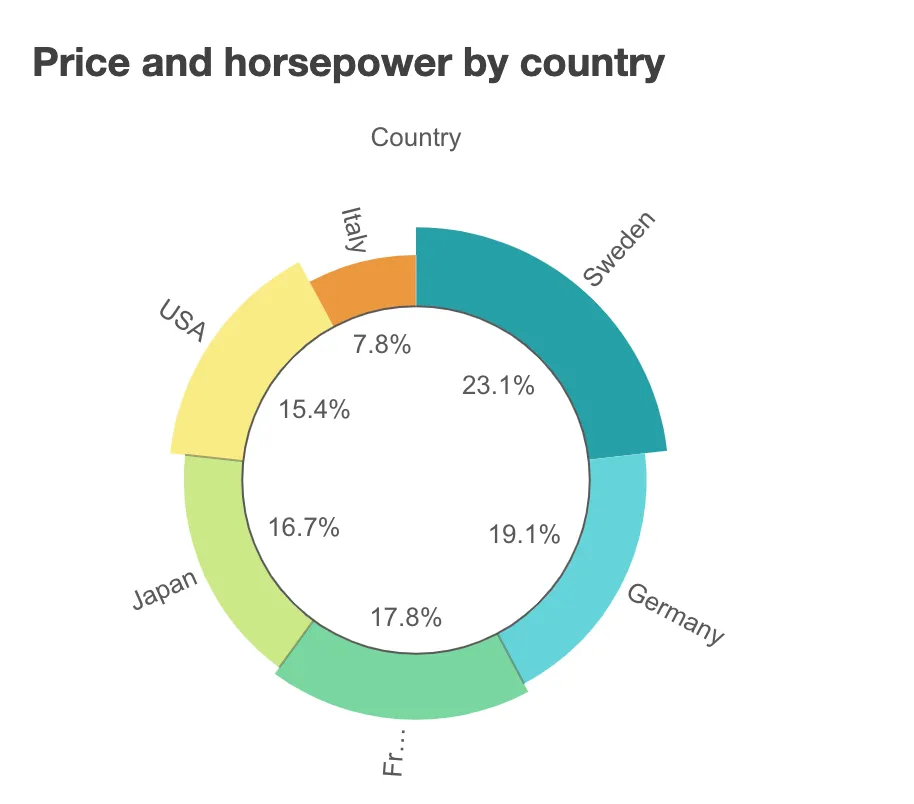
nuked.render({  element: document.querySelector(".pie"),  type: "pie-chart",  fields: ["Country", "=Avg(Price)", "=Avg(Horsepower)"],
  // Overrides default properties  properties: {    title: "Price and horsepower by country",    dataPoint: {      labelMode: "share",    },    donut: {      showAsDonut: true,    },  },});