Creating org charts
Where possible, use qlik-embed and qlik/api rather than this framework.
The org chart is good for showing hierarchical structures, such as the relations of an organization. Starts at the top and allows for navigation through the hierarchy.
Learn more about the org chart, or review the org chart API specification.
const embeddable = window.stardust.embed(app, {  context: { theme: 'light' },  types: [    {      name: 'orgchart',      load: () => Promise.resolve(window['sn-org-chart']);    },  ],});
// Rendering an org chartembed.render({  type: 'orgchart',  element: document.querySelector('.sn-org-chart'),  fields: ['EmployeeID', 'ManagerID'],});
Dataset
The org chart expects the data sent in to be set up in a specific way. The first dimension should contain the ID of the node, and the second dimension should be the ID of the parent node. A node without an ID in the second dimension will become a root node. A more thorough explanation of the expected dataset structure can be found in the Org chart documentation on Qlik Help.
Options
- viewState - settings for the initial rendering of the org chart
Requirements
Requires @nebula.js/stardust version 2.1.0 or later.
Installing
If you use npm: npm install @nebula.js/sn-org-chart. You can also load
through the script tag directly from
https://unpkg.com.
More examples
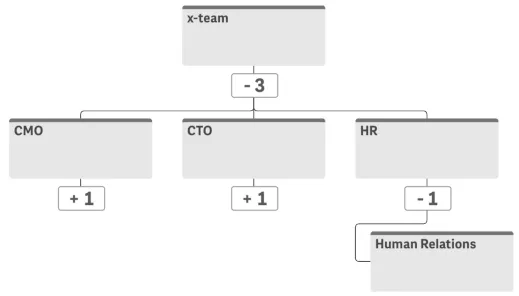
Title, subtitle and description
Each node can have a label, sublabel, and extra label. The label will replace the node ID given in the first dimension in the visualization.
// Rendering an org chart with title, subtitle and descriptionembed.render({ type: "orgchart", element: document.querySelector(".sn-org-chart"), fields: ["EmployeeID", "ManagerID"], properties: { qHyperCubeDef: { qDimensions: [ { qDef: { qFieldDefs: ["EmployeeID"], }, qAttributeExpressions: [ { qExpression: "Name", qAttribute: true, id: "labelExpression", }, { qExpression: "Role", qAttribute: true, id: "subLabelExpression", }, { qExpression: "Org", qAttribute: true, id: "extraLabelExpression", }, ], }, ], qInitialDataFetch: [ { qWidth: 5, qHeight: 15, }, ], }, },});Adding a measure
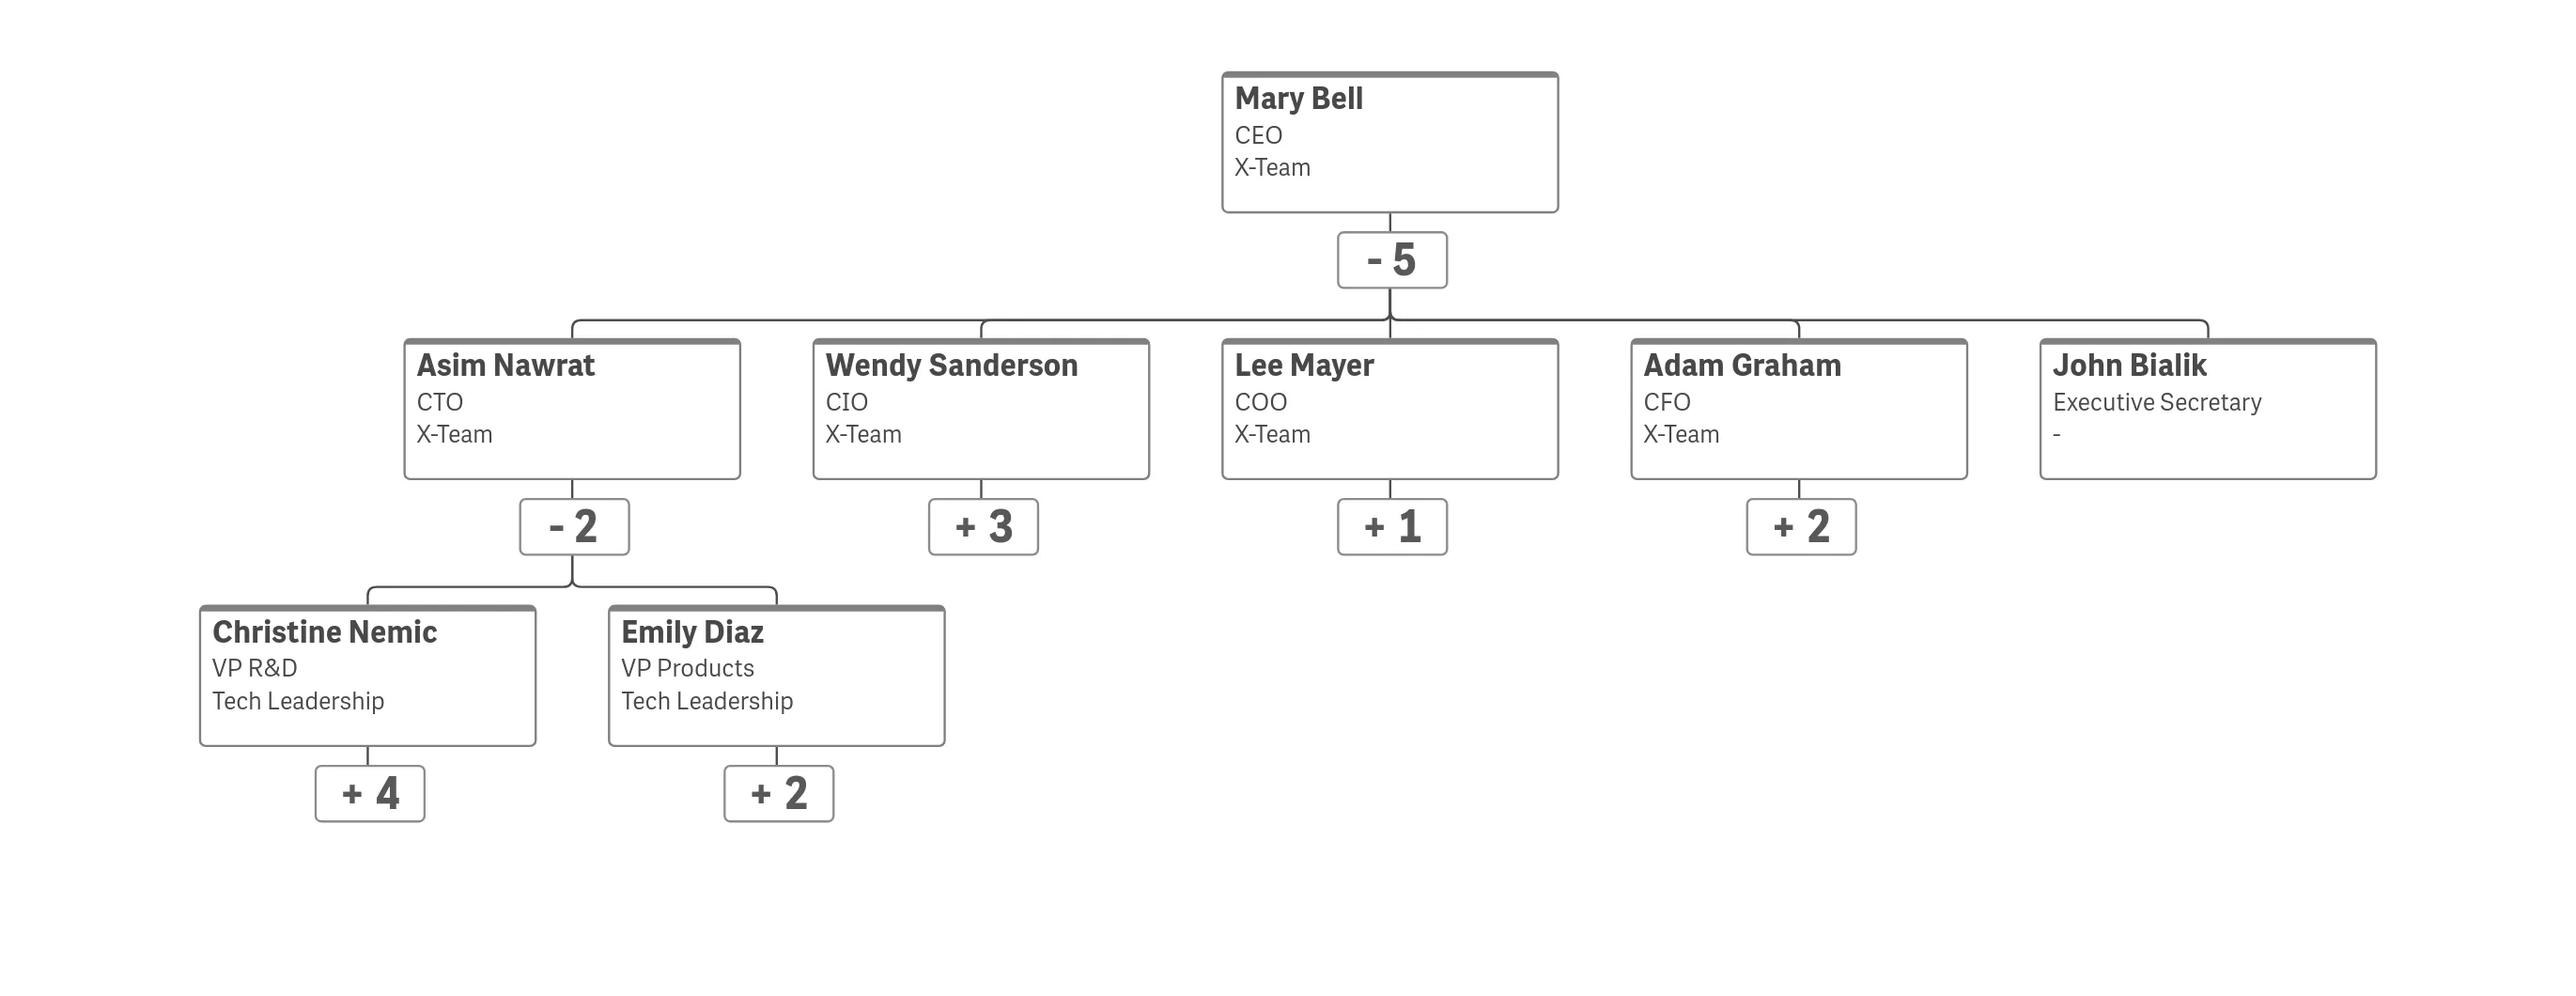
A measure can be added to the org chart. This will then be displayed in the third row of the card, replacing the extra label. However, both the extra label and the measure will be visible in the tooltip.
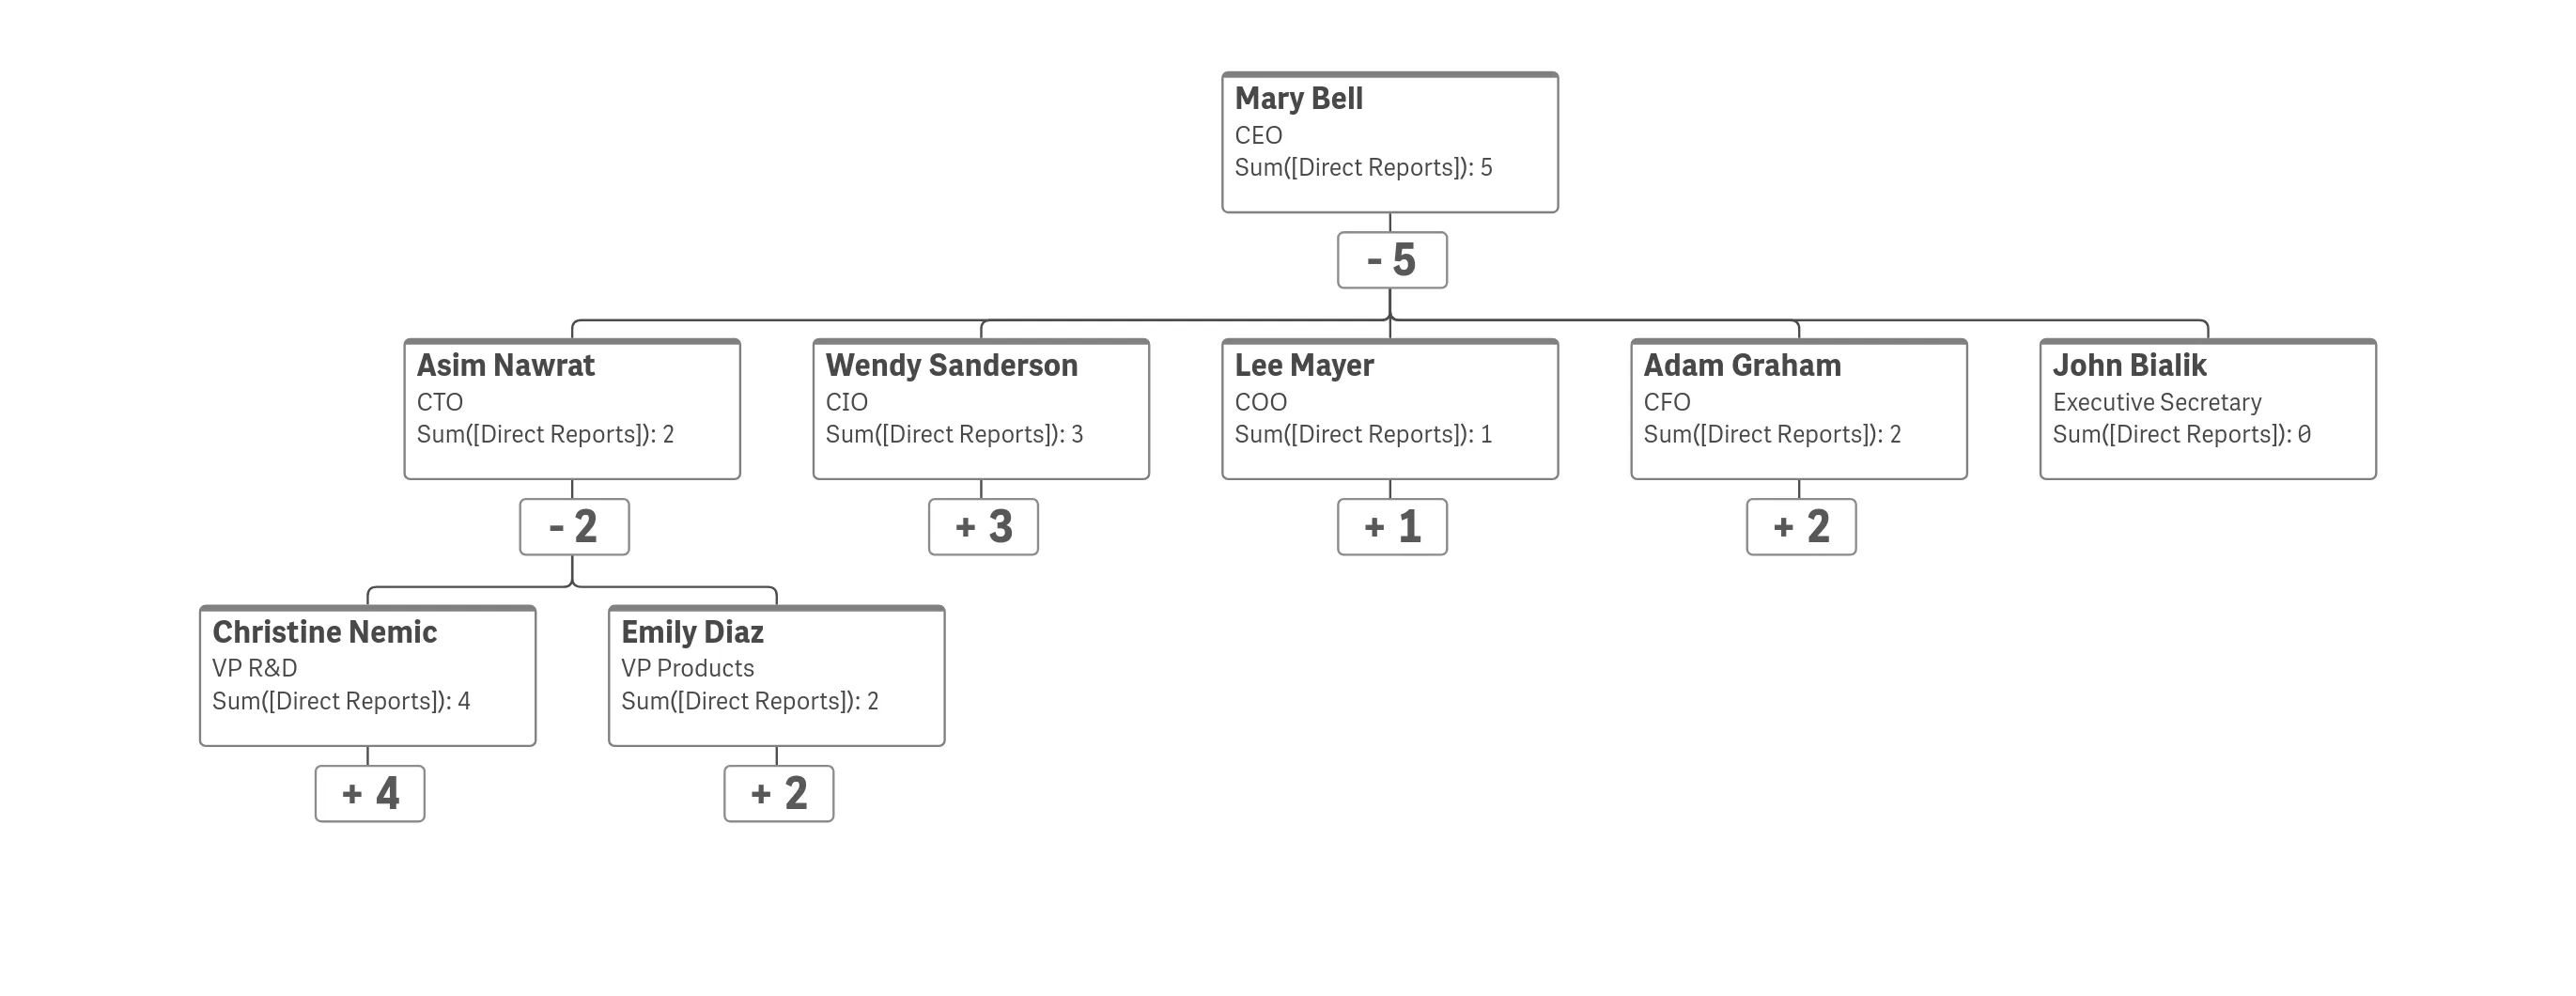
// Rendering an org chart and adding a measureembed.render({ type: "orgchart", element: document.querySelector(".sn-org-chart"), fields: ["EmployeeID", "ManagerID", "=Sum([Direct Reports])"],});Entire tree presentation mode
The default presentation mode is free, where nodes can be expanded and collapsed to traverse the tree. It is also possible to set the presentation mode to expandAll, which will show the whole tree at all times. It is still possible to zoom and pan in the chart.
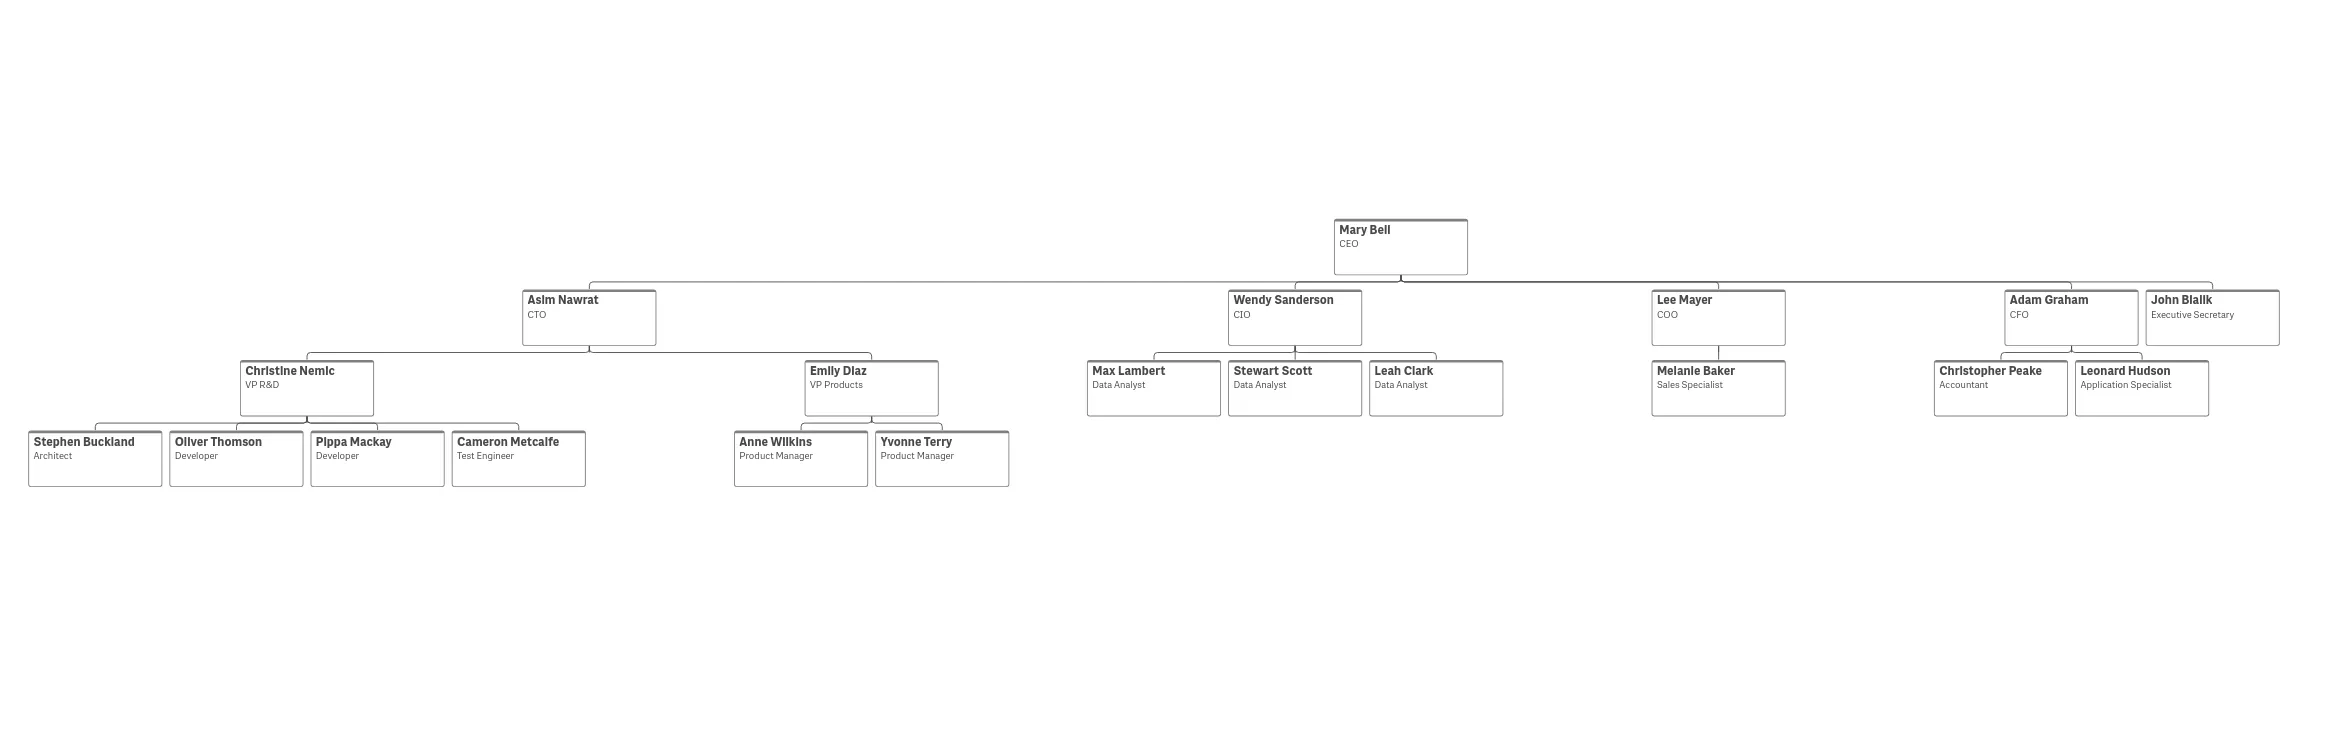
// Rendering an org chart with entire tree presentation modeembed.render({ type: "orgchart", element: document.querySelector(".sn-org-chart"), fields: ["EmployeeID", "ManagerID"], properties: { navigationMode: "expandAll", // overrides default properties },});Changing colors
The org chart can be customized by changing the background, font, and border colors. These can be defined by a string, palette index or by expression. The border can also be changed to no borders, just a thin all around border, or just the top border.
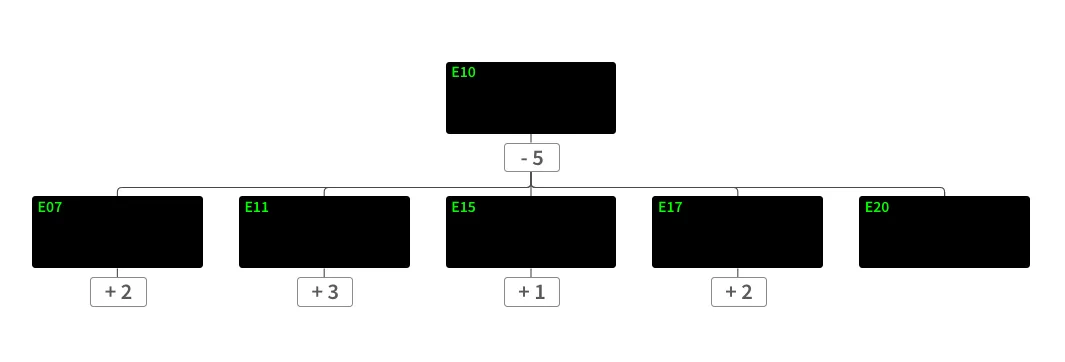
// Rendering an org chart with custom colorsembed.render({ type: "orgchart", element: document.querySelector(".sn-org-chart"), fields: ["EmployeeID", "ManagerID"], properties: { style: { fontColor: { colorType: "colorPicker", color: { color: "#00ff00", }, }, backgroundColor: { colorType: "colorPicker", color: { index: 15, }, }, border: { top: false, fullBorder: false, colorType: "byExpression", colorExpression: { qStringExpression: { qExpr: "", }, }, }, }, },});