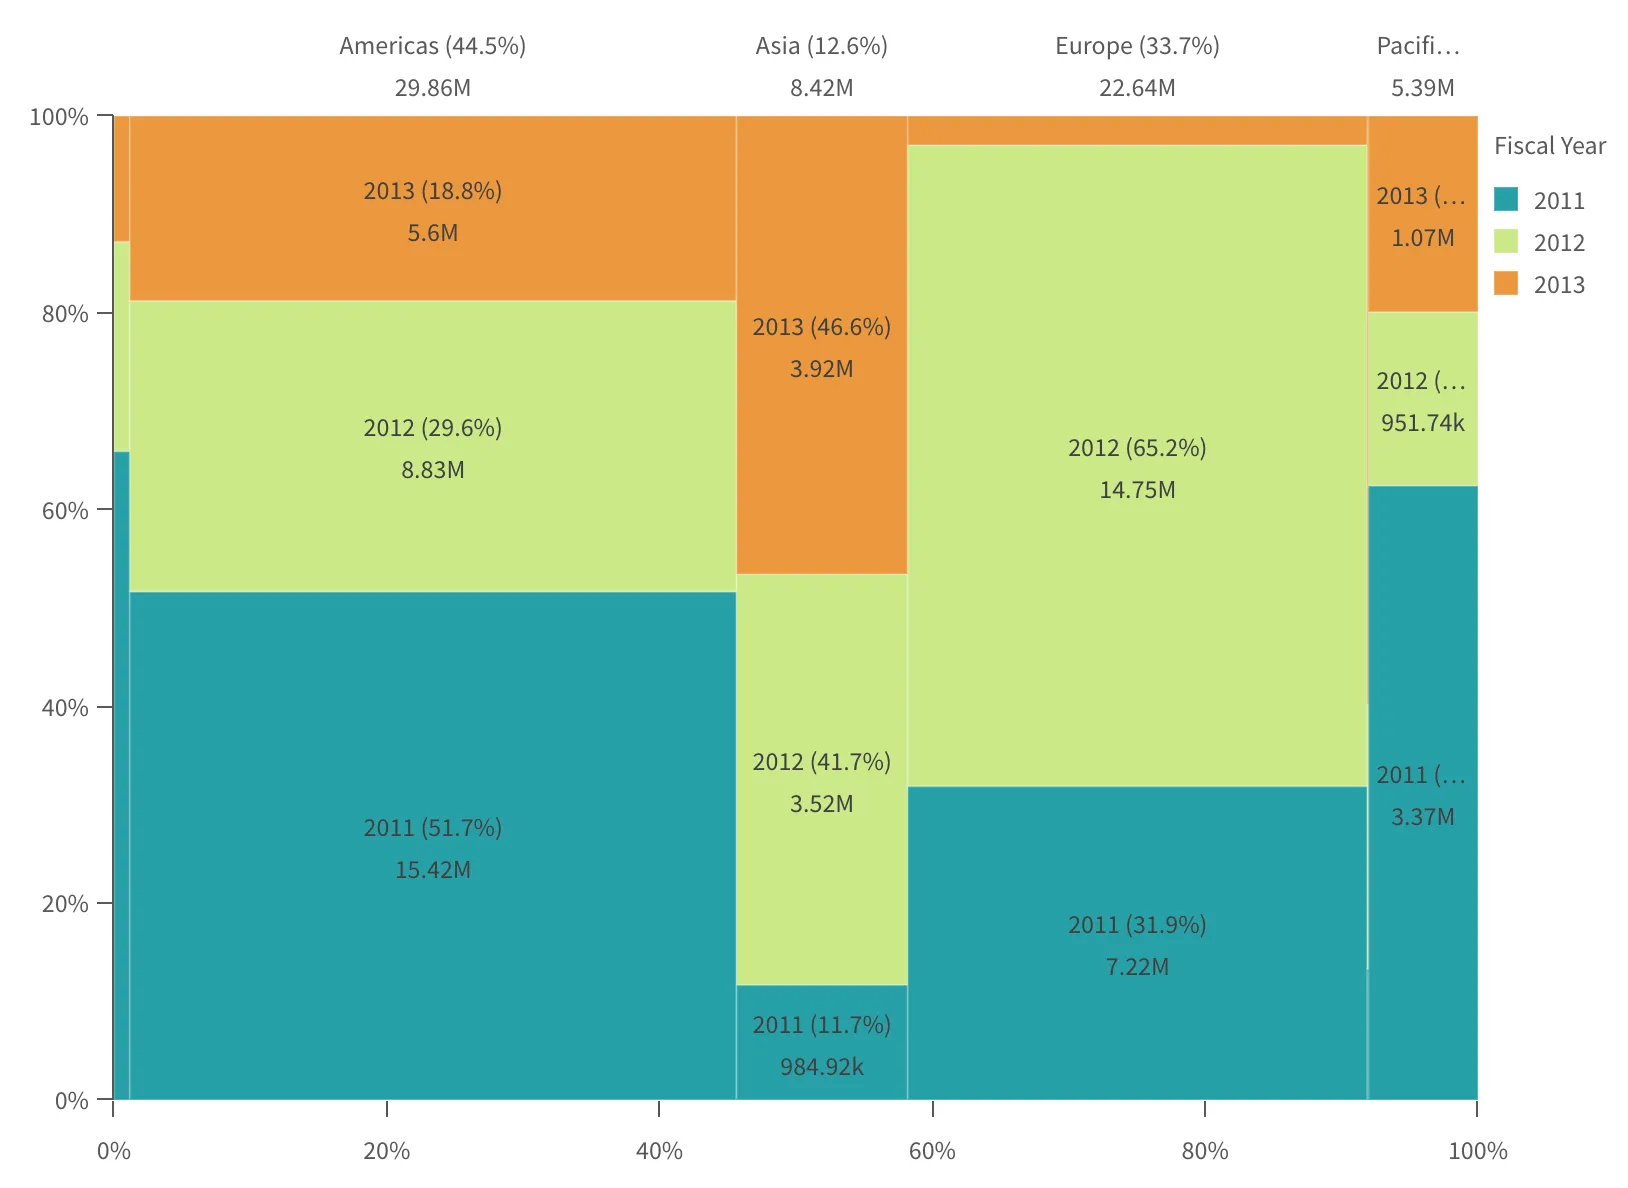
Creating mekko charts
Note
Where possible, use qlik-embed and qlik/api rather than this framework.
A basic mekko chart supernova aimed to be used in nebula.js.
Learn more about the mekko chart, or review the mekko chart API specification.
import { embed } from '@nebula.js/stardust';import mekko from '@nebula.js/sn-mekko-chart';
// 'app' is an enigma app modelconst embeddable = embed(app, {  types: [{ // register the mekko chart    name: 'mekko',    load: () => Promise.resolve(mekko);  }]});
embeddable.render({  element,  type: 'mekko',  fields: ['Region', 'Fiscal Year', '=Sum(Sales)'],});
Requirements
Requires @nebula.js/stardust version >=1.7.0.
Installing
If you use npm: npm install @nebula.js/sn-mekko-chart. You can also load through the script tag directly from any of
the CDNs that supports NPM packages, for example: unpkg.
More examples
Color by dimension
In this example the first dimension (Region) is used to color each cell.
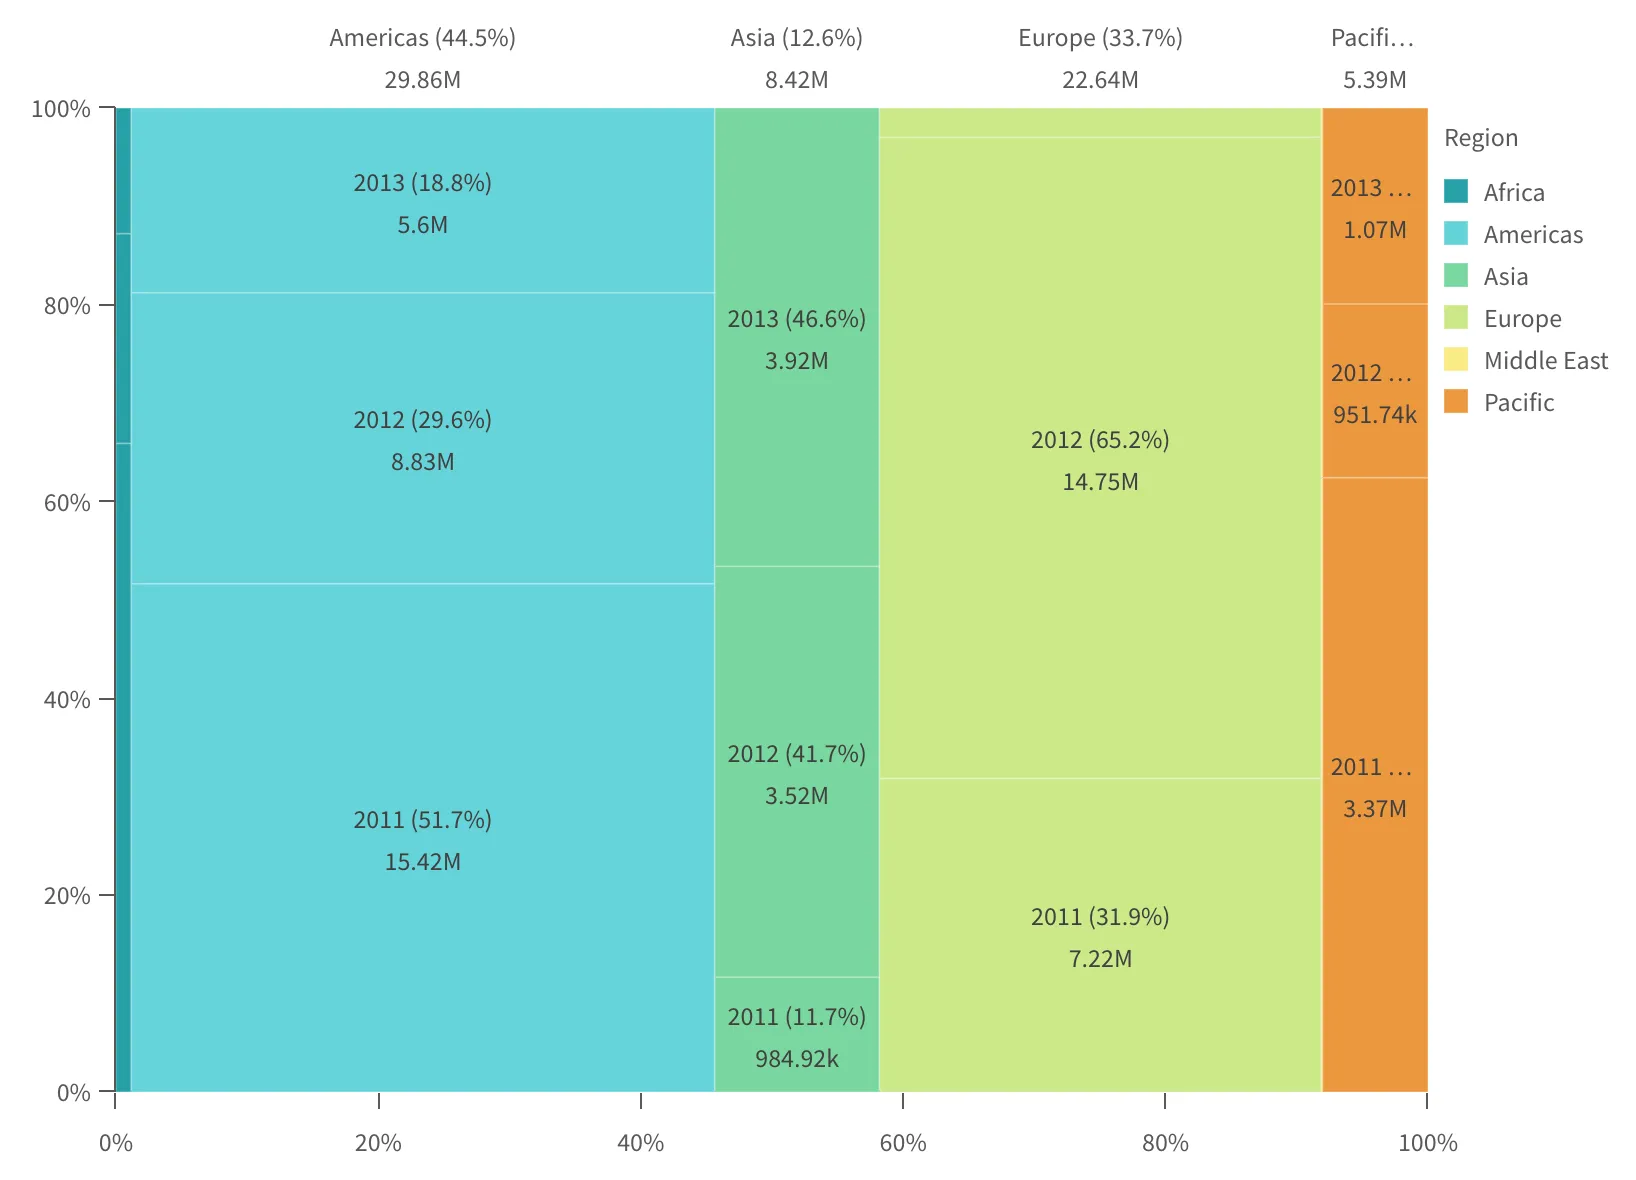
embeddable.render({ element, type: "mekko", fields: ["Region", "Fiscal Year", "=Sum(Sales)"], properties: { cellColor: { mode: "byDimension", byDimension: { type: "index", typeValue: 0 }, }, },});