Creating map charts
Note
Where possible, use qlik-embed and qlik/api rather than this framework.
Maps enable you to view your data geographically. Maps have many ways to present your data. You can add multiple layers to your map to display different types of information on the same map. You can set a custom scope for locations so that if two locations have the same name, you display the locations and their data correctly. You can add custom base maps to your map and use non-WGS-84 coordinates.
Learn more about the map chart, or review the GitHub repository.
Layers
- Point layer: A point layer overlays individual locations on a map, representing them with shapes.
- Geodata layer: A geodata layer enables you to display a custom base map for your map visualization.
More details can be found in the docs folder of the sn-map
repository: https://github.com/qlik-oss/sn-map
Requirements
Requires @nebula.js/stardust version 2.3.0 or later.
Installing
If you use npm: npm install @nebula.js/sn-map
Usage
import { embed } from '@nebula.js/stardust';import map from '@nebula.js/sn-map';
// 'app' is an enigma app modelconst nuked = embed(app, {  types: [    {      // register the map      name: 'map',      load: () => Promise.resolve(map),    },  ],});
// Rendering a map on the fly// Best way is to make a sn-map extension in the client and copy the properties// You will need add the serverUrl and serverKey to the optionsnuked.render({  type: 'map',  element,  options: {    configuration: { serverUrl: ...,  serverKey: ... }  },  properties: {    ...  },});
Options
- configuration
- serverUrl - host URL for map server.
- serverKey - key for map server.
Examples
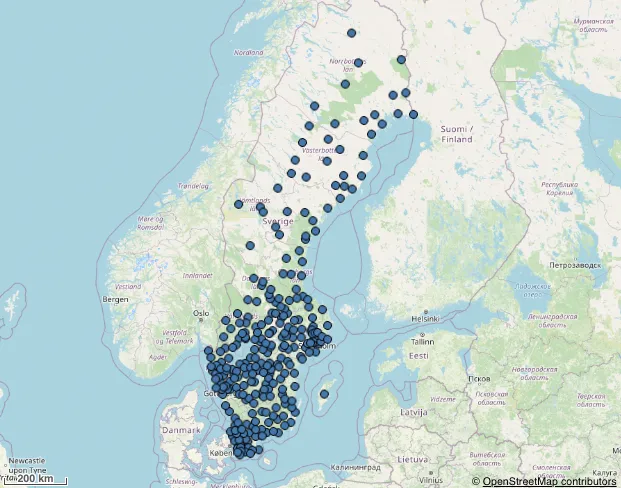
Map with a point layer
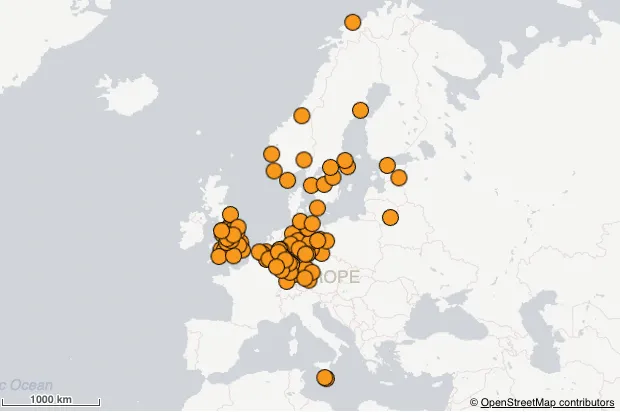
nuked.render({ type: 'map', element, options: { configuration: { serverUrl: ... , serverKey: ... , }, }, properties: { gaLayers: [ { type: 'PointLayer', qHyperCubeDef: { qDimensions: [ { qDef: { qFieldDefs: [ 'id' ], }, qAttributeExpressions: [ { qExpression: 'latitude', id: 'locationOrLatitude' }, { qExpression: 'longitude', id: 'longitude' } ], } ], qMeasures: [], qInitialDataFetch: [ { qLeft: 0, qTop: 0, qWidth: 1, qHeight: 10000 } ], }, size: { radiusMin: 4, radiusMax: 12, }, color: { mode: 'primary', paletteColor: { index: 9, color: '#f8981d' }, }, locationOrLatitude: { key: 'latitude', type: 'expression' }, isLatLong: true, id: 'tWTdanX' } ], mapSettings: { showScaleBar: true, }, },});Map with a wms geodata layer
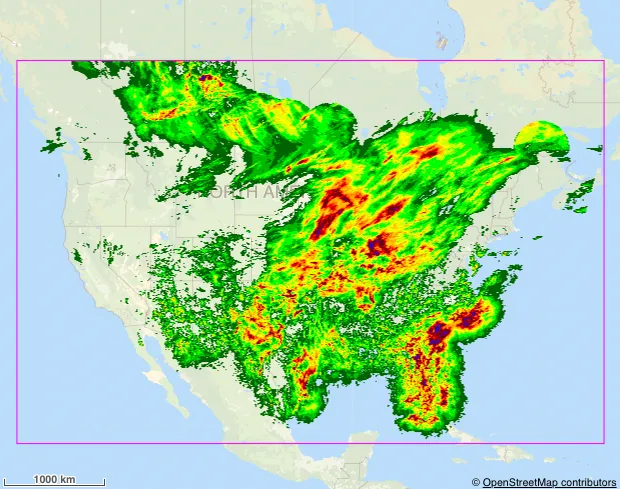
nuked.render({ type: "map", element, properties: { gaLayers: [ { type: "GeodataLayer", dataType: "tms", wms: { url: "https://nowcoast.noaa.gov/arcgis/services/nowcoast/analysis_meteohydro_sfc_qpe_time/MapServer/WmsServer", version: "1.1.0", hasWmsLoaded: true, selectedCrs: "EPSG:3857", selectedFormat: "PNG", capabilities: { layers: [ { name: "1", title: "Image", selected: true, }, { name: "2", title: "Image Footprints with Time Attributes", selected: true, }, { name: "3", title: "Boundary", selected: true, }, ], transparent: true, }, }, id: "bKgjAA", }, ], mapSettings: { showScaleBar: true, }, },});