Creating KPI charts
Note
Where possible, use qlik-embed and qlik/api rather than this framework.
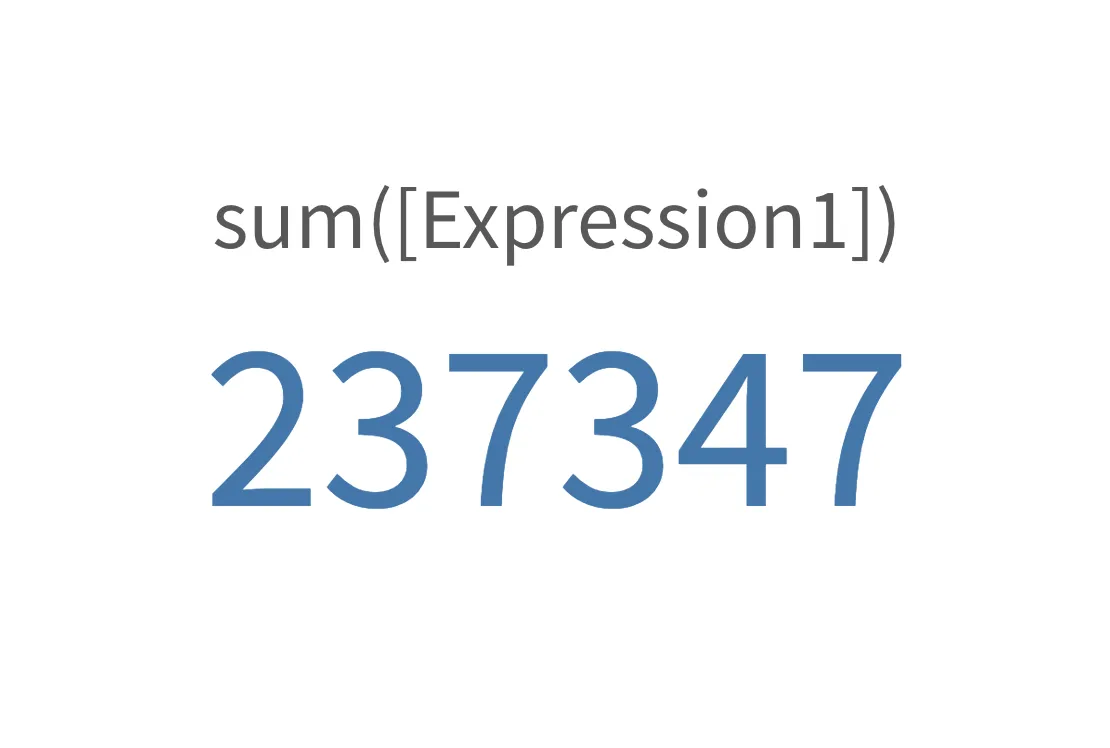
The KPI visualization can show one or two measure values, and is used to track performance.
Learn more about the KPI chart, or review the KPI chart API specification.

// Configure nucleusconst nuked = window.stardust.embed(app, {  context: { theme: "light" },  types: [    {      name: "kpi",      load: () => Promise.resolve(window["sn-kpi"]),    },  ],});
nuked.render({  type: "kpi",  element: document.querySelector(".kpi"),  fields: ["=Sum(Expression1)"],  options: {    freeResize: true,  },});
Options
- freeResize - in conjunction with snapshotData on layout, lets the chart ignore size set on snapshotData