Creating histogram charts
Where possible, use qlik-embed and qlik/api rather than this framework.
The histogram is suitable for visualizing distribution of numerical data over a continuous interval, or a certain time period. The data is divided into bins, and each bar in a histogram represents the tabulated frequency at each bin.
Learn more about the histogram chart, or review the histogram chart API specification.
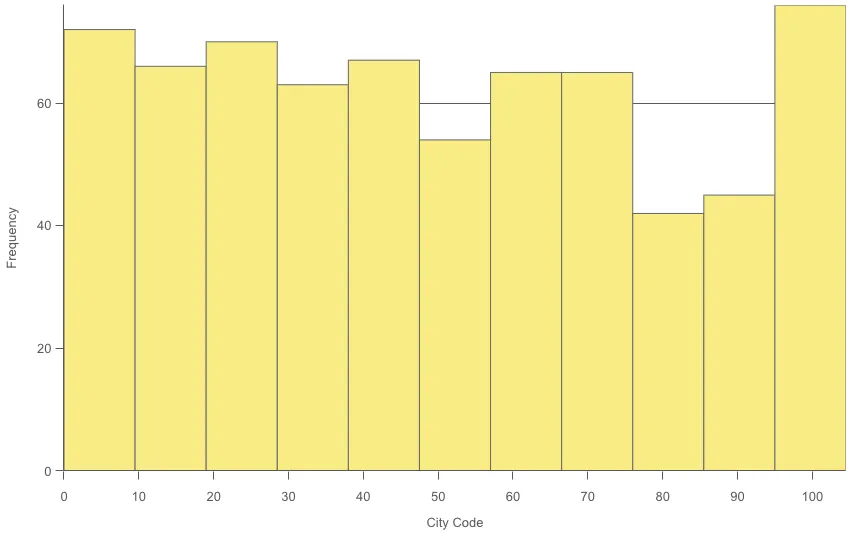
// 'app' is an enigma app modelconst embeddable = embed(app, {  types: [    {      // register histogram chart      name: 'histogram',      load: () => Promise.resolve(histogram),    },  ],});
embeddable.render({  element,  type: 'histogram',  fields: ['City Code'],  }});
Requirements
Requires @nebula.js/stardust version 1.4.0 or later.
Installing
If you use npm: npm install @nebula.js/sn-histogram.
You can also load through the script tag directly from
https://unpkg.com.
More examples
Number of bars
Set maximum number to the number of bars
you want to divide the data into.
Setting binMode property to maxCount and
set binCount to the number of bars that you want the chart to display.
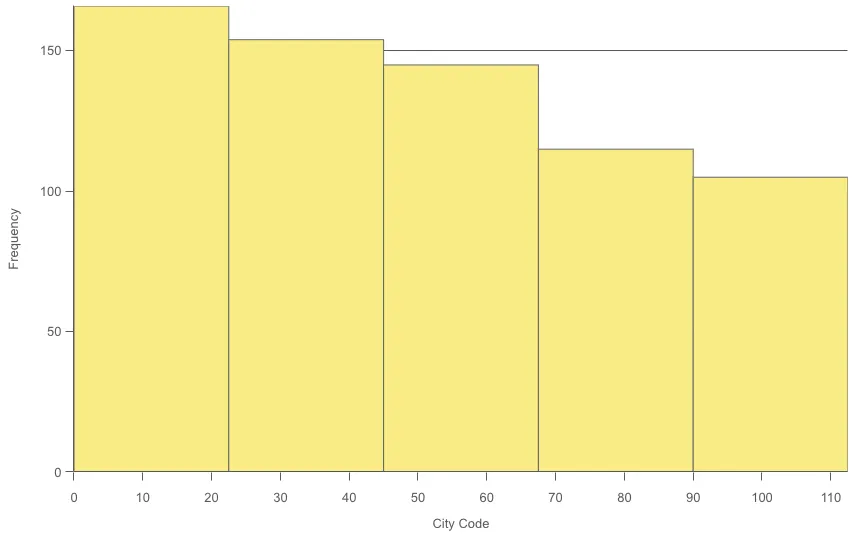
embeddable.render({ element, type: "histogram", fields: ["City Code"], // overrides default properties properties: { bins: { auto: false, binMode: "maxCount", binCount: 5, binSize: 10, offset: 0, countDistinct: false, }, },});Bar width (x-axis)
Set width to define how wide each bar is. This is based on the values on the x-axis. You can offset the bars by changing the Offset setting. If you set Width to 2 and keep the default Offset setting 0, your bars may be defined 0 to 2, 2 to 4, 4 to 6, and so forth. If you change Offset to 1, the bars are defined −1 to 1, 1 to 3, 3 to 5, and so forth.
Setting binMode property to size and set binSize and offset to desired numbers.
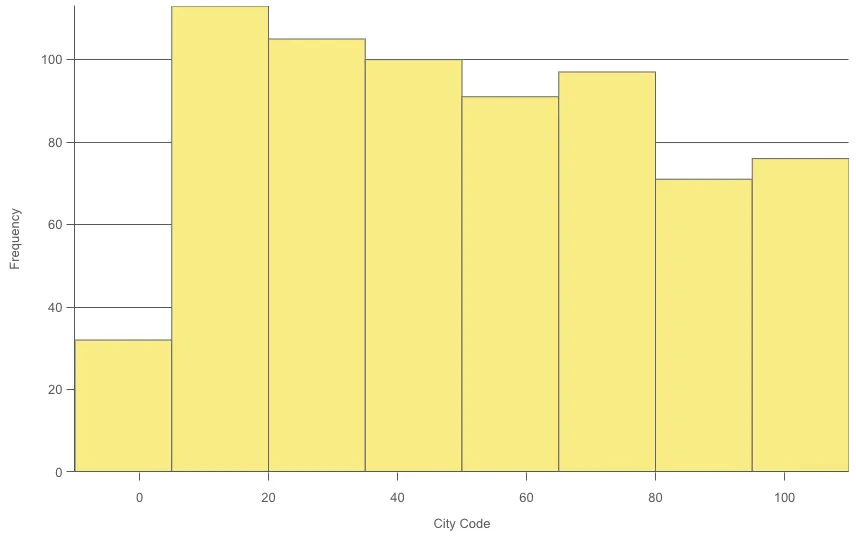
embeddable.render({ element, type: "histogram", fields: ["City Code"], // overrides default properties properties: { bins: { auto: false, binMode: "size", binCount: "", binSize: 15, offset: 5, countDistinct: false, }, },});Count distinct values only
Setting countDistinct property to true to exclude duplicate values.
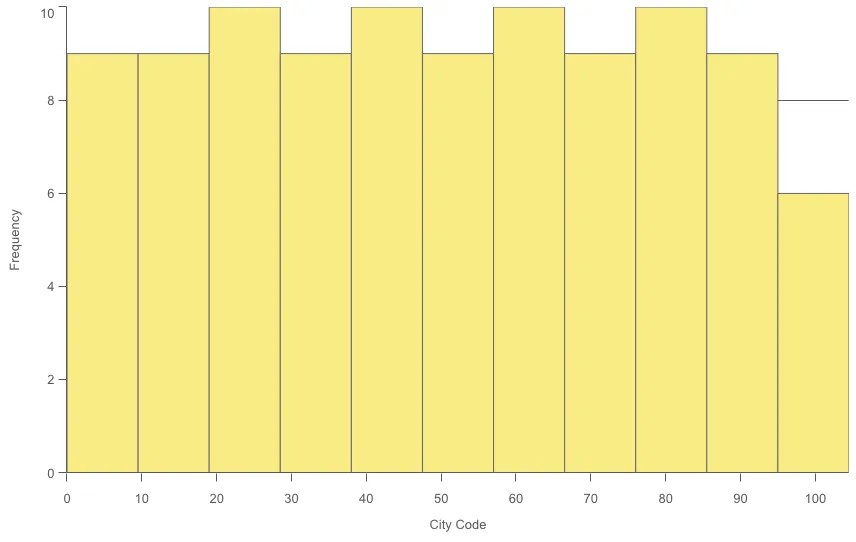
embeddable.render({ element, type: "histogram", fields: ["City Code"], // overrides default properties properties: { bins: { auto: true, binMode: "maxCount", binCount: "", binSize: 10, offset: 0, countDistinct: true, }, },});