Creating funnel charts
Where possible, use qlik-embed and qlik/api rather than this framework.
The funnel chart lets you add a sequential chart showing the connected stages of a process. Each stage decreases and should contain a subset of the previous stage. The decrease is gradual, giving the chart an ever narrower funnel.
Learn more about the funnel chart, or review the funnel chart API specification.
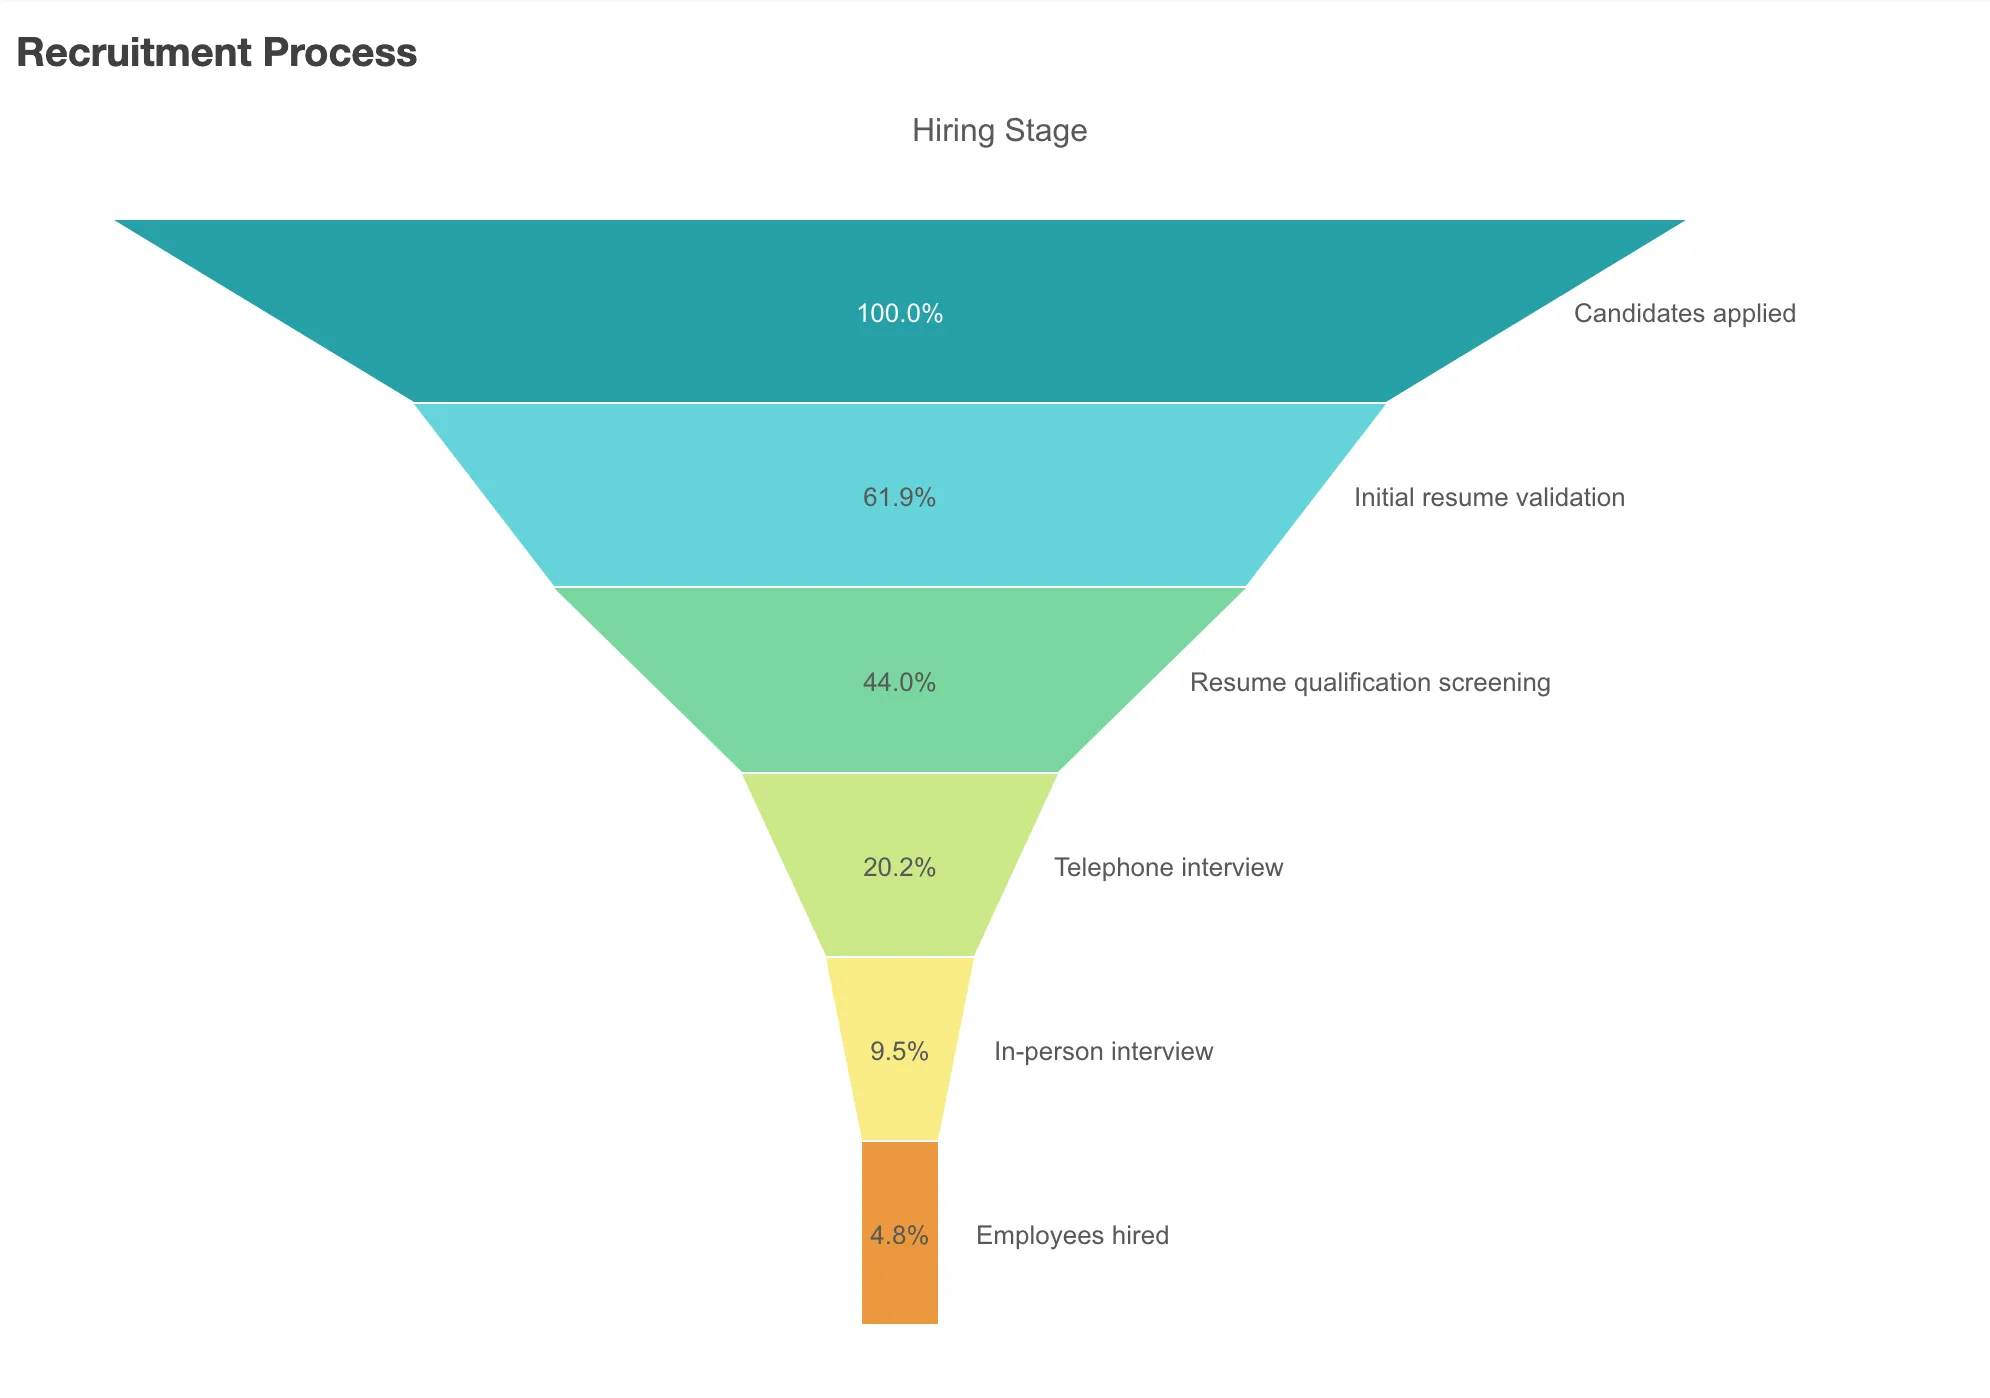
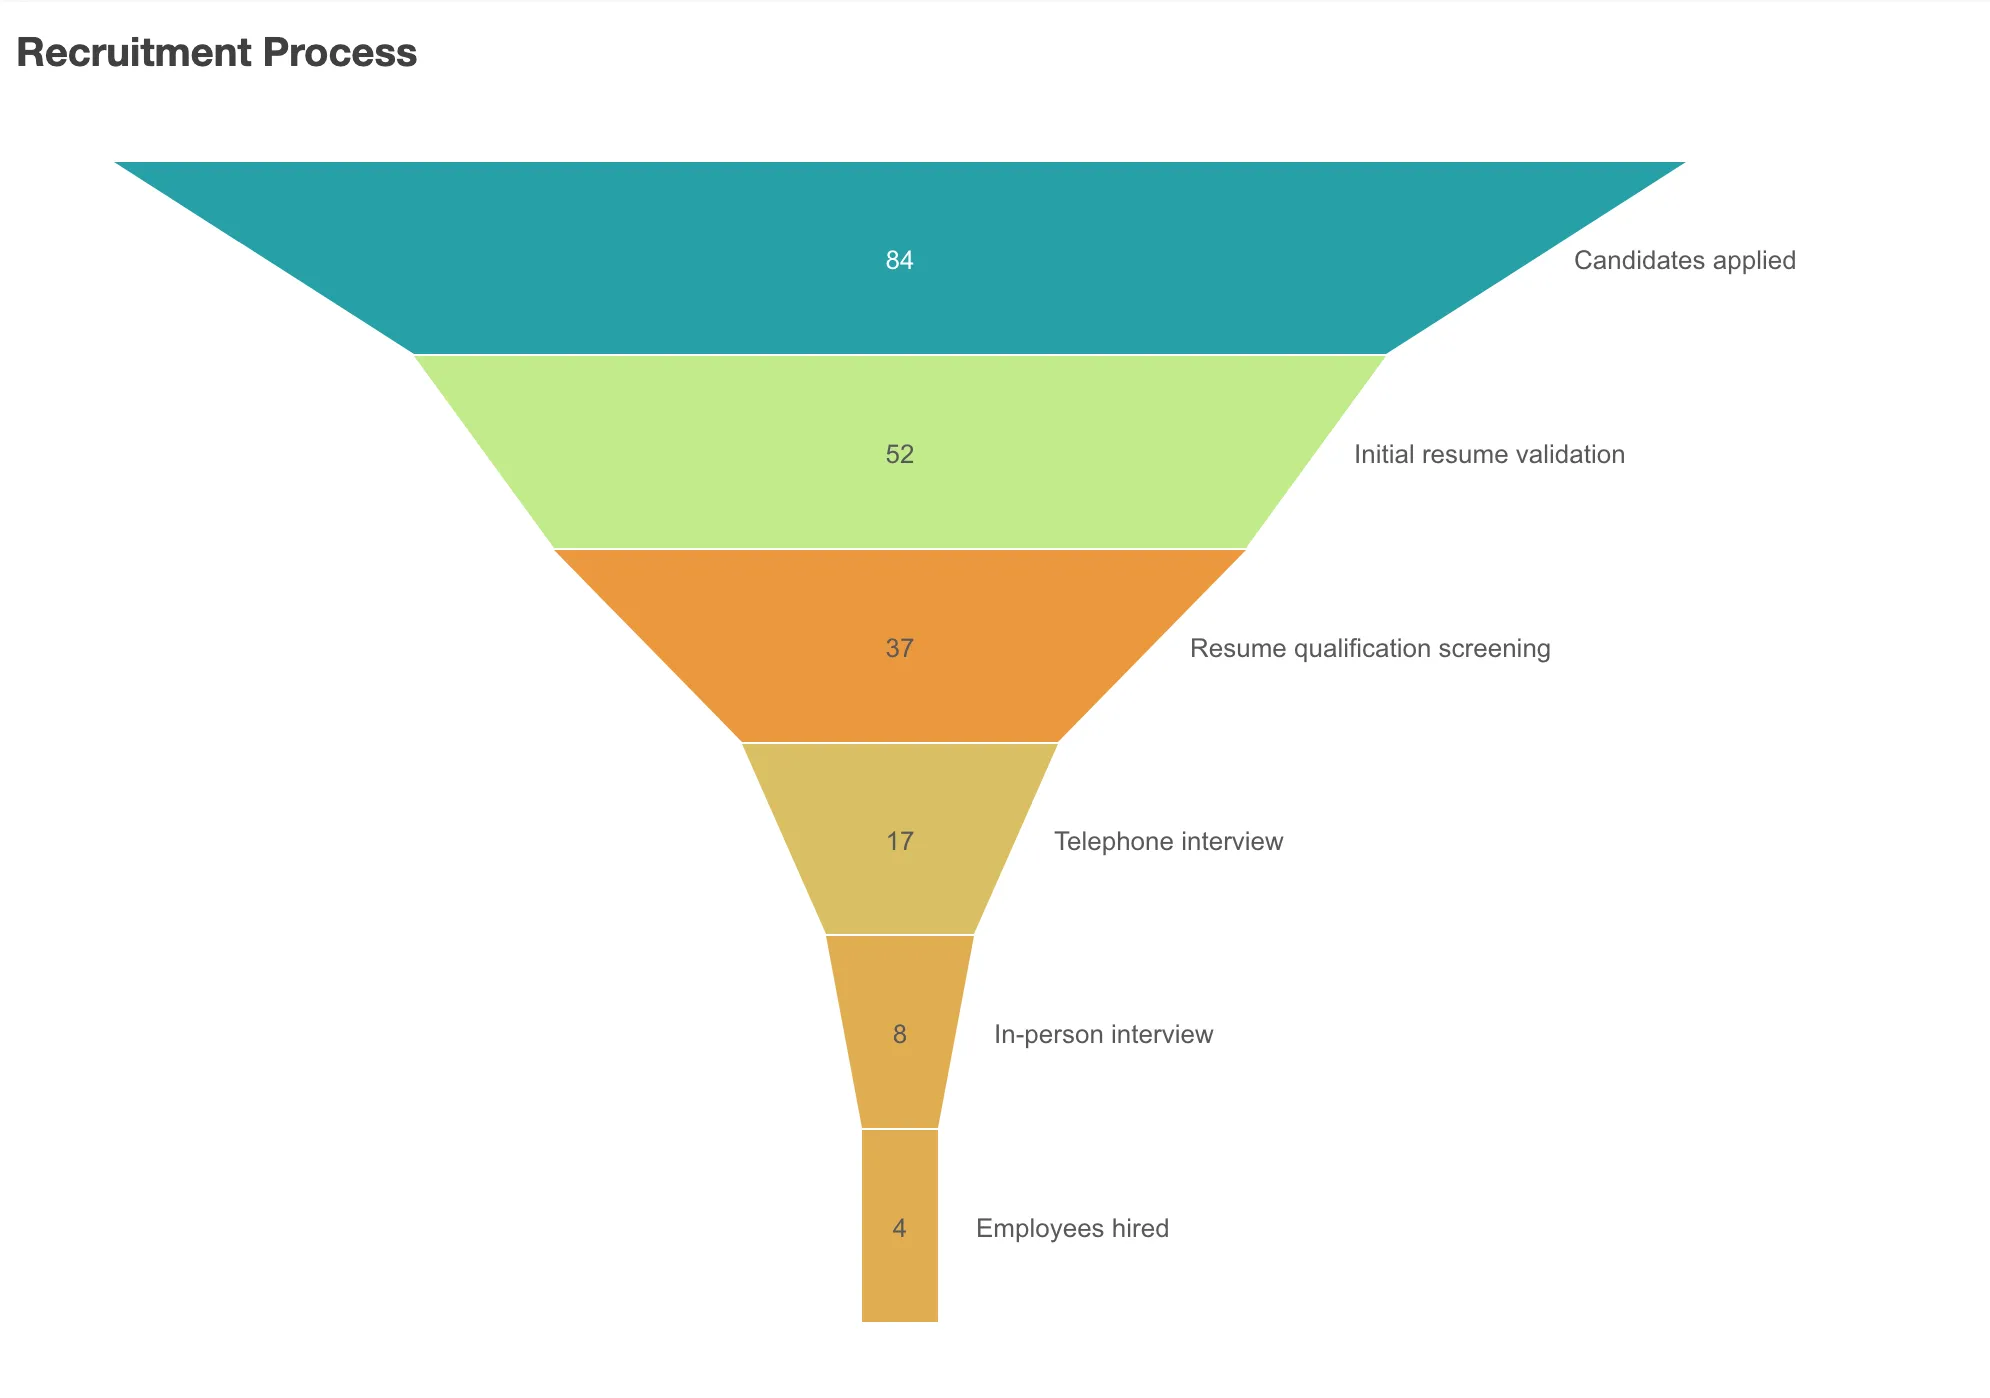
The example below shows the number of candidates during sequential stages
of a recruitment process. The chart is plotted in width mode, where the
quantity at each stage is proportional to the upper edge of the segment.
// configure nucleusconst nuked = window.stardust.embed(app, {  context: { theme: "light" },  types: [    {      name: "funnel-chart",      load: () => Promise.resolve(window["sn-funnel-chart"]),    },  ],});
// Rendering a simple funnel chartnuked.render({  element: document.querySelector(".funnel"),  type: "funnel-chart",  fields: ["Hiring Stage", "=Sum(NumberOfCandidates)"],  properties: {    title: "Recruitment Process",  },});
Funnel chart can represent anything that is decreasing in size, showing a process that starts at 100% and ends with a lower percentage. The funnel chart is the opposite to a pyramid graph, which has increasing stages instead of decreasing stages.
The chart requires one dimension and one measure. Unlike bar charts, funnel chart segments are centered to create a funnel shape.
Requirements
Requires @nebula.js/stardust version 1.2.0 or later.
Installing
If you use npm: npm install @nebula.js/sn-funnel-chart.
You can also load through the script tag directly from
https://unpkg.com.
More examples
Area mode
You can configure the funnel chart so that the area of each item is proportional to the measure.
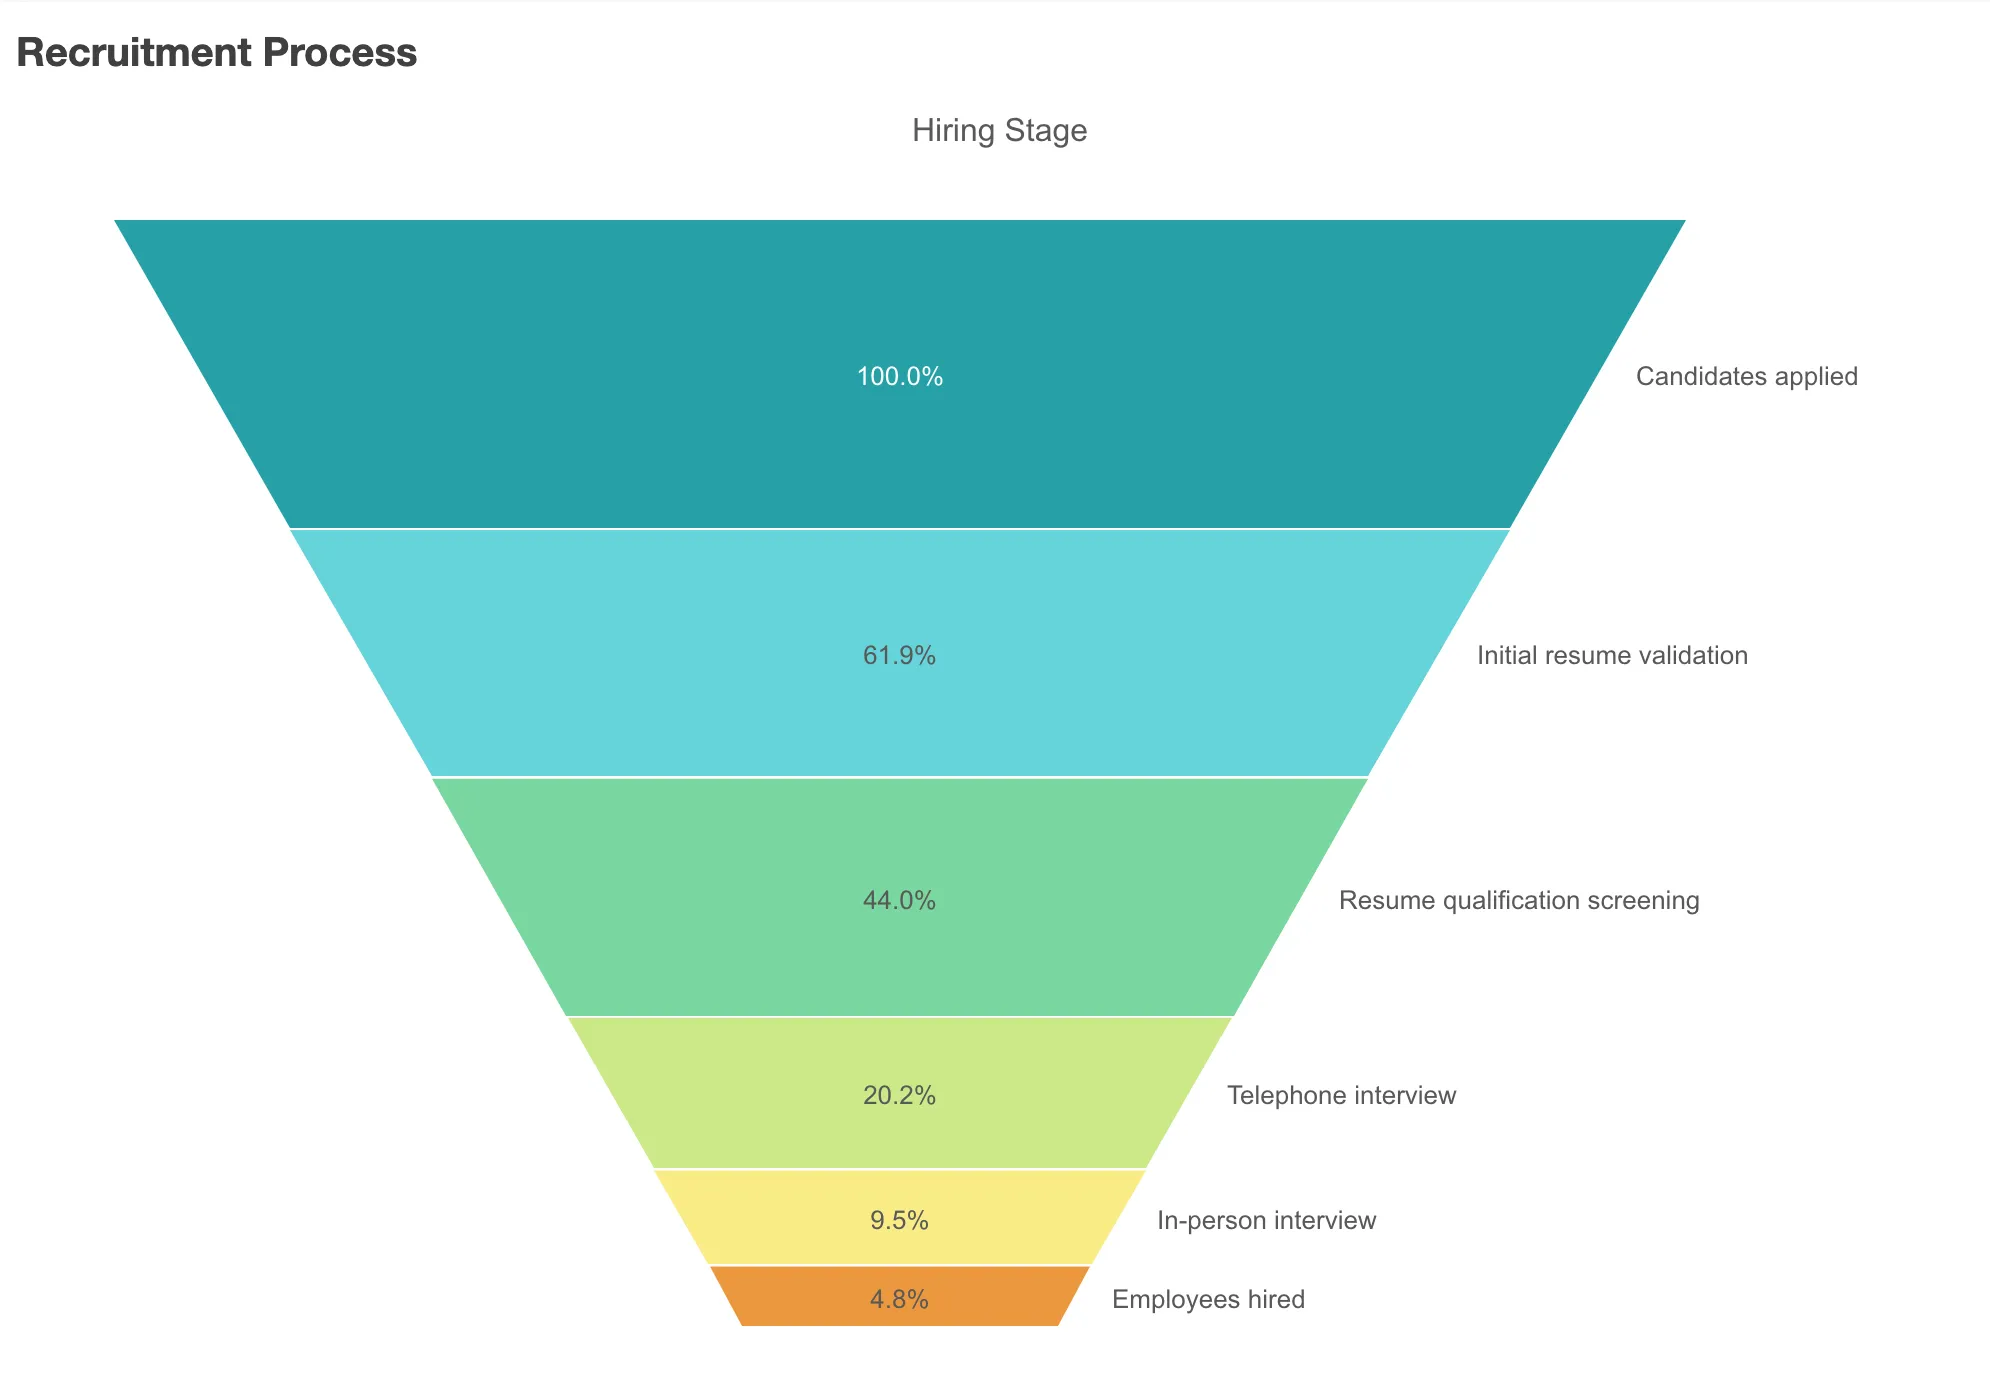
// Rendering a funnel chart in area modenuked.render({ element: document.querySelector(".funnel"), type: "funnel-chart", fields: ["Hiring Stage", "=Sum(NumberOfCandidates)"], properties: { title: "Recruitment Process", funnel: { mode: "AREA", }, },});Height mode
The height of each item is proportional to the measure.
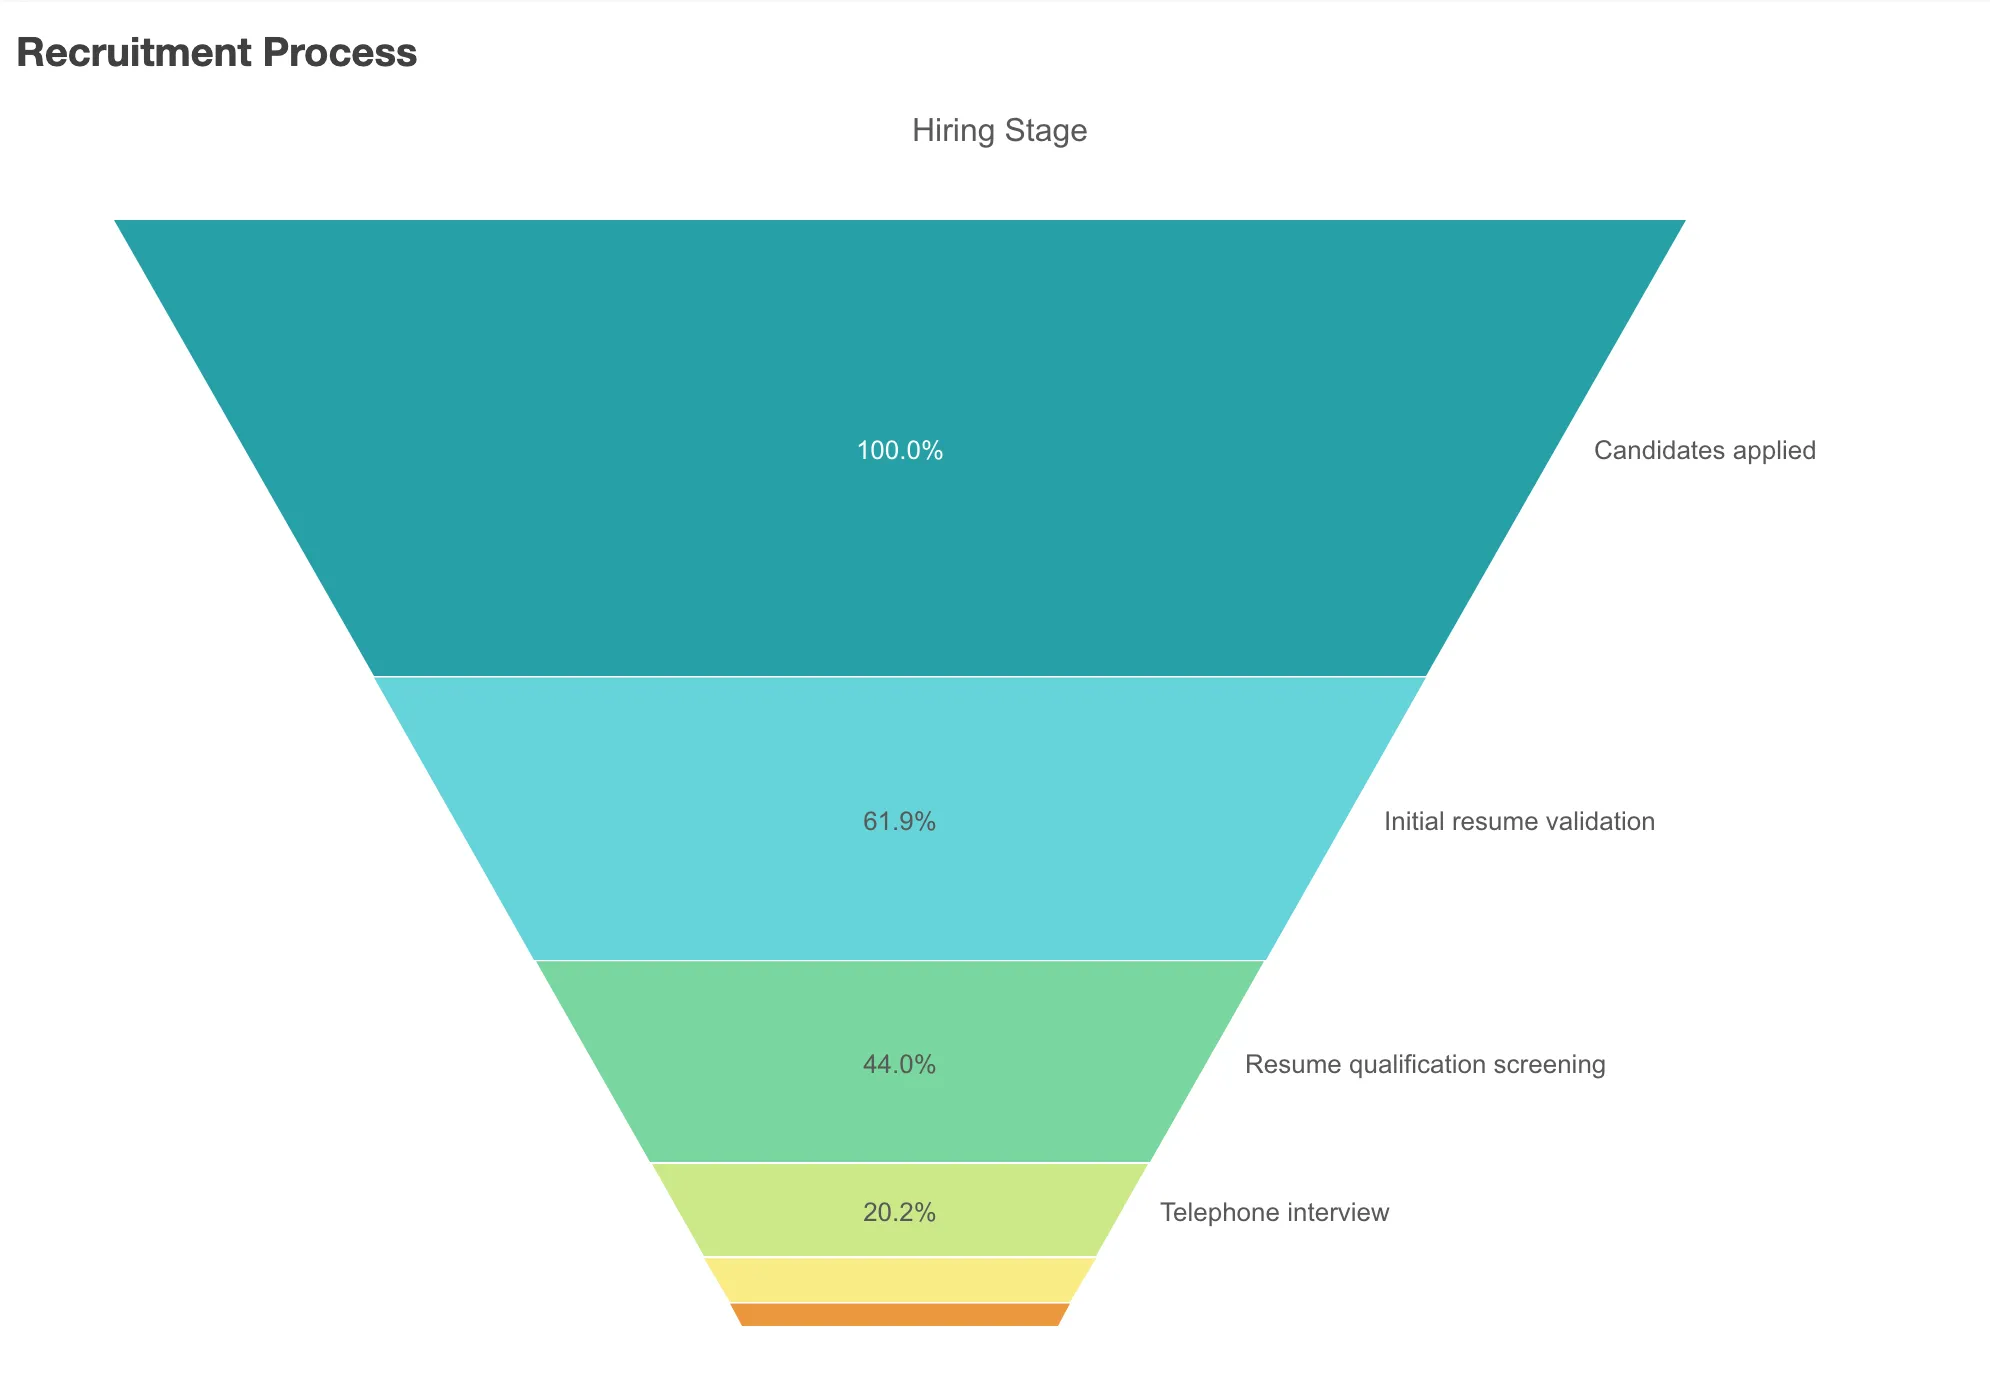
// Rendering a funnel chart in height modenuked.render({ element: document.querySelector(".funnel"), type: "funnel-chart", fields: ["Hiring Stage", "=Sum(NumberOfCandidates)"], properties: { title: "Recruitment Process", funnel: { mode: "HEIGHT", }, },});Ordering mode
Only order matters, the items have the same height, ordered from top to bottom.
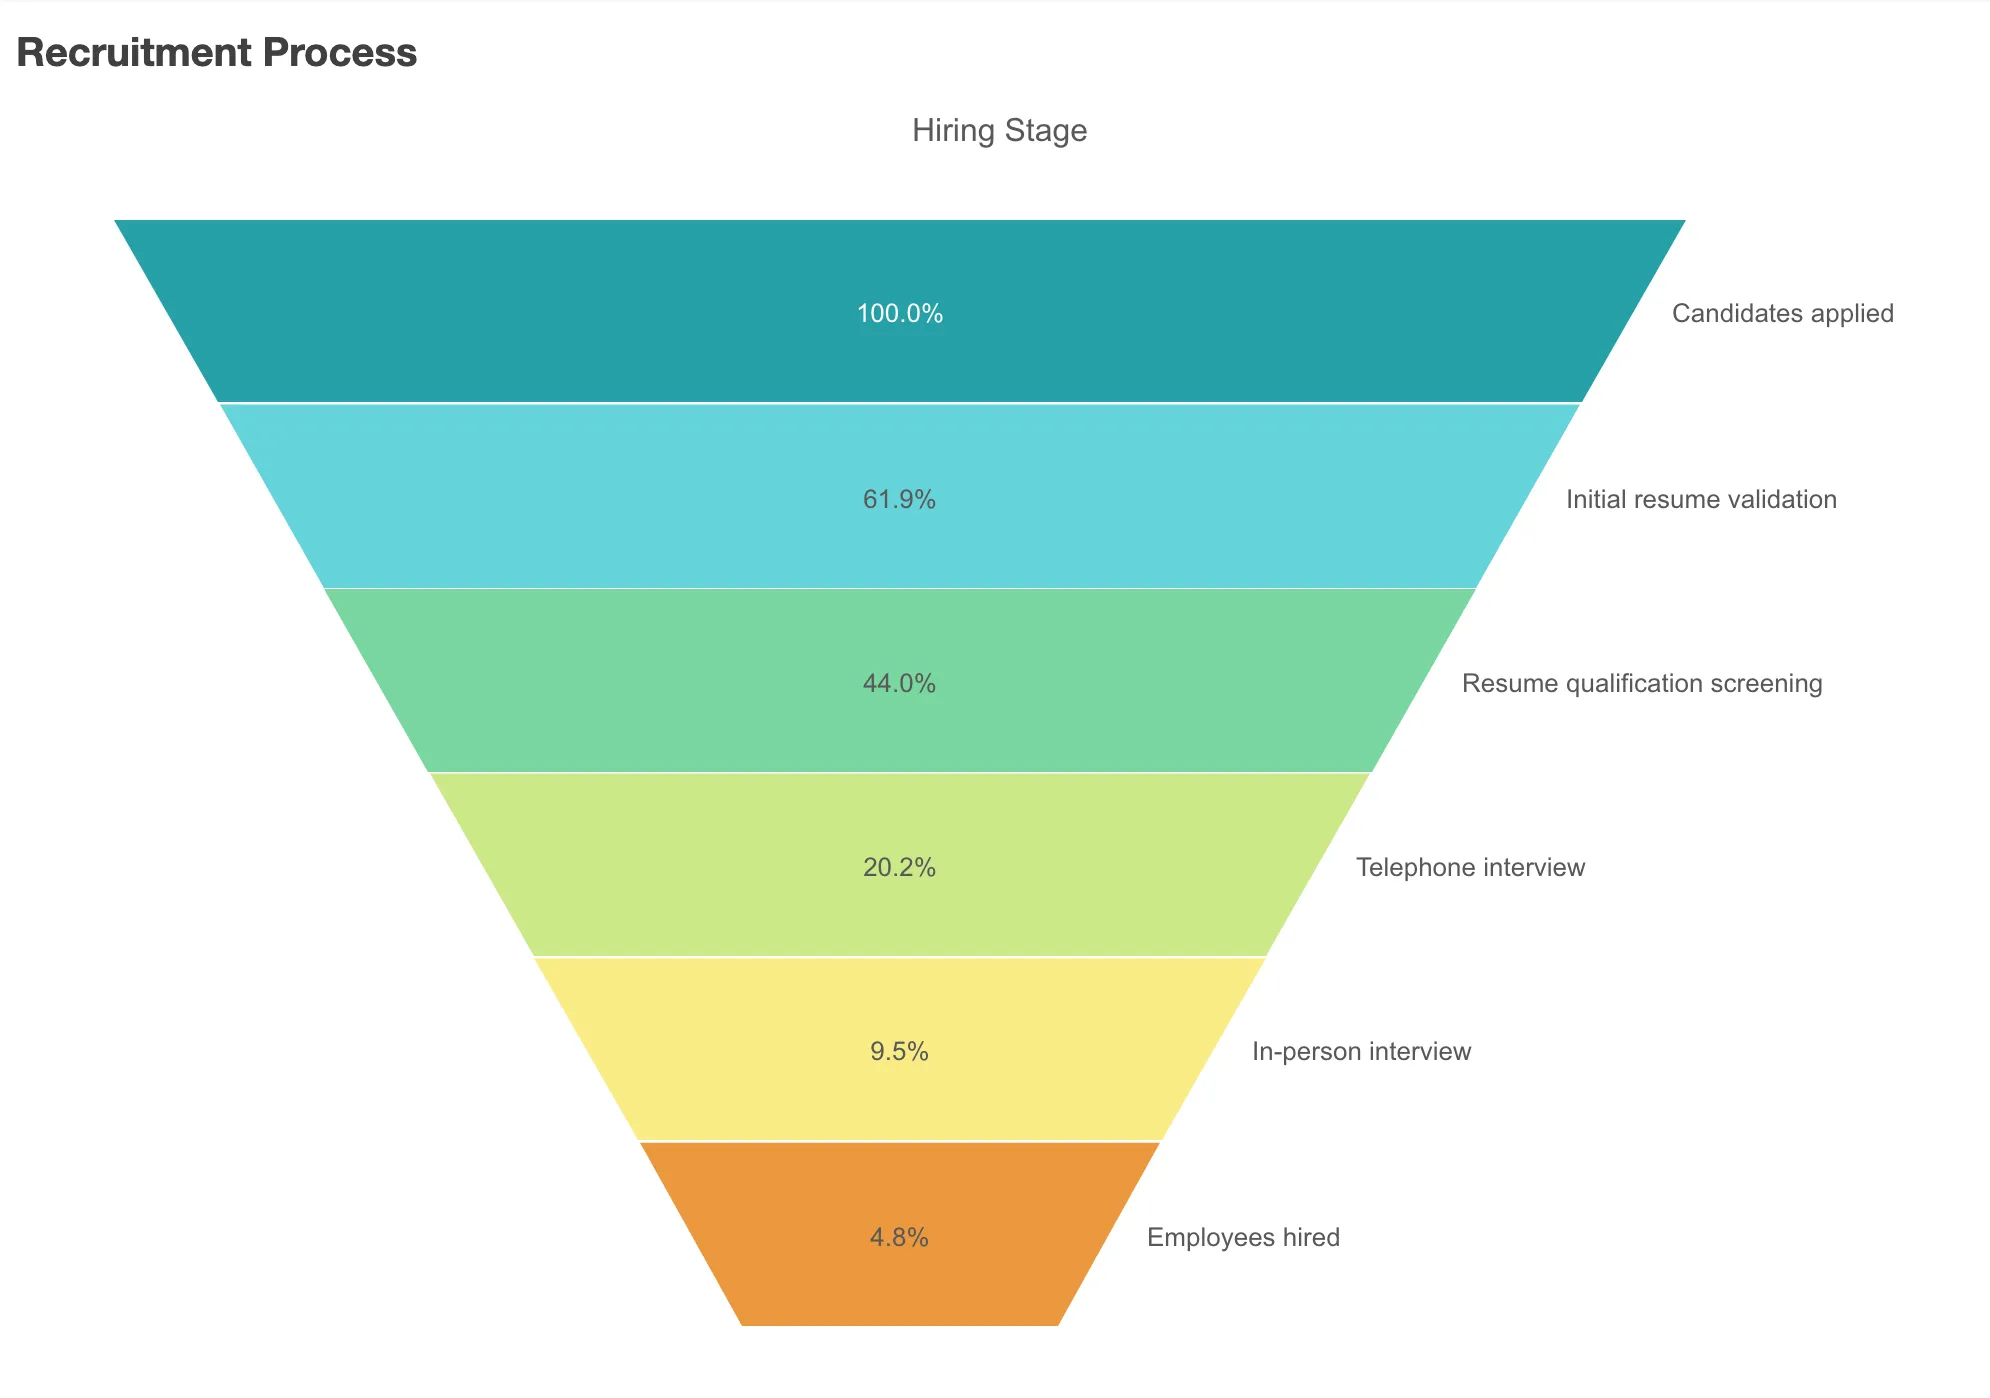
// Rendering a funnel chart in order modenuked.render({ element: document.querySelector(".funnel"), type: "funnel-chart", fields: ["Hiring Stage", "=Sum(NumberOfCandidates)"], properties: { title: "Recruitment Process", funnel: { mode: "ORDER", }, },});More configurations
You can also remove the dimension title, show the actual number of candidates instead of the percentage, or color the stages by measure.
// Rendering a funnel chart with customized looknuked.render({  element: document.querySelector(".funnel"),  type: "funnel-chart",
  // Defines the fields in `properties`  properties: {    title: "Recruitment Process",
    // Hide dimension title    showDimensionTitle: false,
    qHyperCubeDef: {      qDimensions: [        {          qDef: { qFieldDefs: ["Hiring Stage"] },
          // Color the dimension by `MedianRequestedSalary`          qAttributeExpressions: [            {              qExpression: "Avg(MedianRequestedSalary)",              id: "colorByAlternative",            },          ],        },      ],      qMeasures: [        {          qDef: { qDef: "Sum(NumberOfCandidates)" },        },      ],      qInterColumnSortOrder: [1, 0],      qInitialDataFetch: [        {          qLeft: 0,          qTop: 0,          qWidth: 2,          qHeight: 5000,        },      ],    },
    // Show actual number of candidates instead of percentage    dataPoint: {      auto: false,      labelMode: "value",    },
    // Configure color    color: {      auto: false,      byMeasureDef: {        key: "Avg(MedianRequestedSalary)",        type: "expression",      },      measureScheme: "dg",      mode: "byMeasure",      reverseScheme: true,    },  },});