Creating box plot charts
Where possible, use qlik-embed and qlik/api rather than this framework.
The box plot is suitable for comparing range and distribution for groups of numerical data, illustrated by a box with whiskers, and a center line in the middle. The whiskers represent high and low reference values for excluding outlier values.
Learn more about the box plot, or review the box plot API specification.

// 'app' is an enigma app modelconst embeddable = embed(app, {  types: [    {      // register box plot chart      name: "boxplot",      load: () => Promise.resolve(boxplot),    },  ],});
embeddable.render({  element,  type: "boxplot",  fields: ["Region", "Product Group", "=Avg(Sales)"],});
Requirements
Requires @nebula.js/stardust version 1.4.0 or later.
Installing
If you use npm: npm install @nebula.js/sn-boxplot.
You can also load through the script tag directly from
https://unpkg.com.
More examples
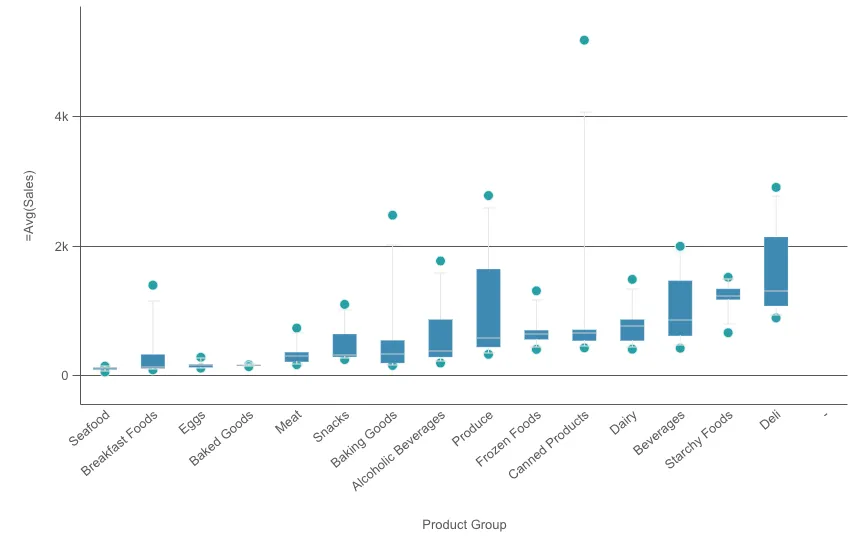
Percentile-based
This preset is defined with the box start and
end points representing the first and third quartiles,
and the center line representing the median,
but the whisker length is adjusted by setting a percentile based whisker position.
The example is using 5/95 percentile.
Setting mode in calculations to fractiles
and fractiles in parameters to 0.05.
// 'app' is an enigma app modelembeddable.render({ element, type: "boxplot", fields: ["Region", "Product Group", "=Avg(Sales)"], // overrides default properties properties: { boxplotDef: { calculations: { auto: true, mode: "fractiles", parameters: { tukey: 1.5, fractiles: 0.05, stdDev: 3, }, }, color: { auto: true, }, elements: { outliers: { include: true, sortOutliers: true, }, }, presentation: { whiskers: { show: true, }, }, qHyperCubeDef: {}, sorting: { autoSort: true, }, }, },});Standard deviation
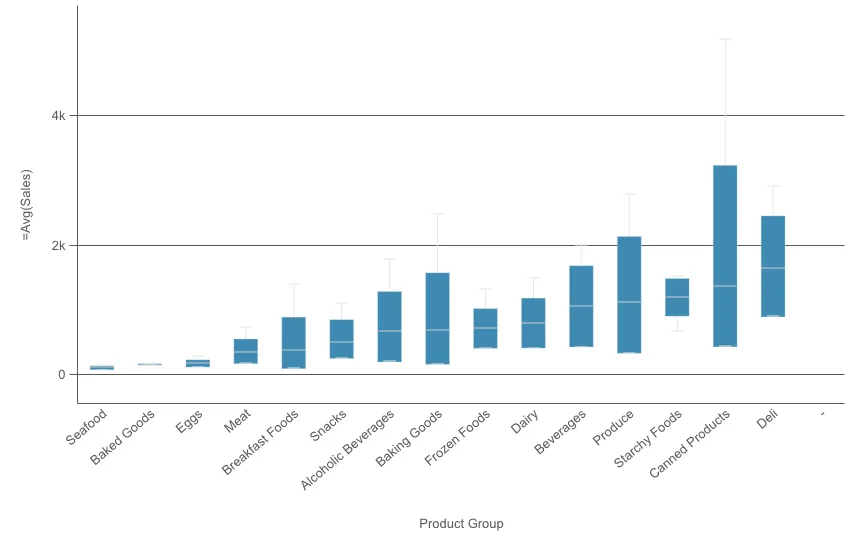
This preset is based on standard deviations,
with the center line representing the average value,
and the box start and end points representing one standard deviation variance.
You can set the whisker length to a multiple of standard deviations.
The example is using two standard deviations.
Setting mode in calculations to stdDev
and stdDev in parameters to 3.
// 'app' is an enigma app modelembeddable.render({ element, type: "boxplot", fields: ["Region", "Product Group", "=Avg(Sales)"], // overrides default properties properties: { boxplotDef: { calculations: { auto: true, mode: "stdDev", parameters: { tukey: 1.5, fractiles: 0.05, stdDev: 3, }, }, color: { auto: true, }, elements: { outliers: { include: true, sortOutliers: true, }, }, presentation: { whiskers: { show: true, }, }, qHyperCubeDef: {}, sorting: { autoSort: true, }, }, },});Customized box plot
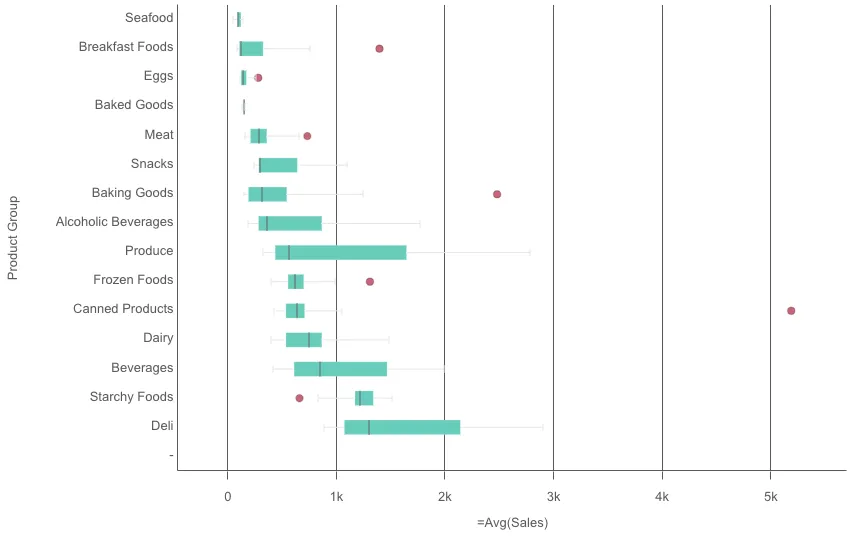
The example defines elements using custom expressions, color and orientation.
The example based on the original box plot definition by J. Tukey. The center line represents the median (second quartile), and the box start and end points represent the first and third quartiles. Whisker length is set to 2 inter-quartile ranges. An inter-quartile range represents the difference between the first and third quartiles.
// 'app' is an enigma app modelembeddable.render({ element, type: "boxplot", fields: ["Region", "Product Group", "=Avg(Sales)"], // overrides default properties properties: { boxplotDef: { calculations: { auto: false, mode: "tukey", parameters: { tukey: 2, fractiles: 0.05, stdDev: 3, }, }, color: { auto: false, box: { paletteColor: { color: "#66ccbb", index: -1, }, }, point: { paletteColor: { color: "#cc6677", index: -1, }, }, }, elements: { firstWhisker: { name: "", expression: { qValueExpression: { qExpr: "Rangemax(Fractile( total <[Product Group]> Aggr( Avg(Sales), [Product Group], [Region] ) ,0.25 ) - ((Fractile( total <[Product Group]> Aggr( Avg(Sales), [Product Group], [Region] ) ,0.75 ) - Fractile( total <[Product Group]> Aggr( Avg(Sales), [Product Group], [Region] ) ,0.25 )) * 2), Min( total <[Product Group]> Aggr( Avg(Sales), [Product Group], [Region] ) ))", }, }, }, boxStart: { name: "", expression: { qValueExpression: { qExpr: "Fractile( total <[Product Group]> Aggr( Avg(Sales), [Product Group], [Region] ) ,0.25 )", }, }, }, boxMiddle: { name: "", expression: { qValueExpression: { qExpr: "Median( total <[Product Group]> Aggr( Avg(Sales), [Product Group], [Region] ) )", }, }, }, boxEnd: { name: "", expression: { qValueExpression: { qExpr: "Fractile( total <[Product Group]> Aggr( Avg(Sales), [Product Group], [Region] ) ,0.75 )", }, }, }, lastWhisker: { name: "", expression: { qValueExpression: { qExpr: "Rangemin(Fractile( total <[Product Group]> Aggr( Avg(Sales), [Product Group], [Region] ) ,0.75 ) + ((Fractile( total <[Product Group]> Aggr( Avg(Sales), [Product Group], [Region] ) ,0.75 ) - Fractile( total <[Product Group]> Aggr( Avg(Sales), [Product Group], [Region] ) ,0.25 )) * 2), Max( total <[Product Group]> Aggr( Avg(Sales), [Product Group], [Region] ) ))", }, }, }, outliers: { include: true, sortOutliers: true, }, }, presentation: { whiskers: { show: true, }, }, qHyperCubeDef: {}, sorting: { autoSort: true, }, }, orientation: "horizontal", },});