Explore app content using the Insight Advisor APIs
With the Insight Advisor APIs, you can improve your understanding of the data in your app. Inputting a small number of parameters, you will be able to know which analysis types work best for your logical model. You can also gain awareness of the details of your logical model (including fields, master items, and whether or not the logical model is valid).
You can even use the API to directly ask natural language questions, or to specify fields, master items, and a preferred analysis type.
This tutorial includes four lessons to teach you how to use Postman to interact with Insight Advisor through three different API endpoints. These examples are designed to be completed in order.
Prerequisites
-
Download and install Postman.
-
Access to a Qlik Cloud tenant.
-
Download the “Beginner’s tutorial” Qlik Cloud app as a
.qvffile from Qlik Help. -
Upload the app into the cloud hub. For more information, see Uploading apps on Qlik Help. Ensure that you have Can view access to the app.
-
An access token or API key. For more information, see Authentication.
Considerations
The following limitations apply to all three endpoints demonstrated in this tutorial:
-
The functions of these endpoints are not affected by the toggle for Insight Advisor in this app in the Qlik Cloud app.
-
If your Qlik Cloud app is configured with Direct Query capabilities, it will not be available for use by these endpoints.
API endpoints shown in this tutorial
This tutorial contains four lessons. Each lesson will focus on specific features available through the Insight Advisor APIs. It will be broken up as follows:
- Lesson 1:
{URL}/api/v1/apps/{appId}/insight-analyses - Lesson 2:
{URL}/api/v1/apps/{appId}/insight-analyses/model - Lessons 3 and 4:
{URL}/api/v1/apps/{appId}/insight-analyses/actions/recommend
In all the examples, {URL} is your tenant URL.
Lesson 1: Retrieve possible analysis types with details
The first endpoint in this tutorial provides a list of all possible analysis types that can be used to prepare new analyses given the data model of your app.
For each analysis type, the endpoint lists information such as short and long descriptions (the short description represents the name of the analysis type you see in the user interface). It also includes minimum and maximum numbers of various attributes specific to each analysis type, such as:
- Dimensions
- Measures
- Geographic dimensions
- Temporal dimensions
- Fields (shown as “items”)
Calls to this API should not contain any Body parameters.
Start and configure Postman
- Start Postman.
- Under Get started with Postman, click Create new.
- Set the HTTP method to GET.
- Click HTTP Request.
- Enter the following path in the URL area:
https://{URL}/api/v1/apps/{appId}/insight-analyses, where {URL} is your tenant URL. Your app ID can be found in the URL in the web browser when viewing your app. - Before making API requests, add your access token as a Bearer Token to Postman. See Authentication.
- Click Send.
The API’s response will look similar to the following partial excerpt:
 {    "data": [        {            "id": "fact-fact",            "compositions": [                {                    "description": {                        "short": "Calculated measure (KPI)",                        "long": "Show calculated measure."                    },                    "msrs": {                        "min": 1,                        "max": 1                    }                }            ]        },        {            "id": "rank-rank",            "compositions": [                {                    "description": {                        "short": "Ranking",                        "long": "Show dimensions in order of contribution."                    },                    "dims": {                        "min": 1,                        "max": 1                    },                    "msrs": {                        "min": 1,                        "max": 1                    }                }            ]        },        {            "id": "breakdown-geoAnalysis",            "compositions": [                {                    "description": {                        "short": "Breakdown (geospatial)",                        "long": "Show geographical contributions."                    },                    "geos": {                        "min": 1,                        "max": 2                    },                    "msrs": {                        "min": 0,                        "max": 2                    }                }            ]        }
...
    ],    "links": {}}
Change the language of the response
English is used as the default language for the responses. Responses can be optionally delivered in other languages by specifying an ISO-639-1 code in the accept-language Header Parameter.
For a list of languages supported for natural language questions, see Supported languages on Qlik Help.
Change the language to Spanish.
- In the
Headerstab, underkey, type accept-language. - Under
Value, type es. - Click
Send.
The response will look similar to the following partial excerpt:
{    "data": [        {            "id": "fact-fact",            "compositions": [                {                    "description": {                        "short": "Medida calculada (KPI)",                        "long": "Muestra la medida calculada."                    },                    "msrs": {                        "min": 1,                        "max": 1                    }                }            ]        },

...
    ],    "links": {}}
Lesson 2: Retrieve information about app logical model, fields, and master items
The second endpoint covered in this tutorial lists each field and master item in your app’s logical model (classifying it as a dimension, measure, or other), and indicates whether the app uses the default or a custom logical model. If you have defined a logical model that is different from the default, the response will also indicate whether your defined logical model is valid or not.
Configure Postman
- In Postman, click the plus icon to open a new tab.
- Ensure the HTTP method is set to GET.
- Enter the following path in the URL area:
{URL}/api/v1/apps/{appId}/insight-analyses/model, where {URL} is your tenant URL. Your app ID can be found in the URL in the web browser when viewing your app. - Add the API key generated from your tenant as a Bearer Token.
- Click
Send.
The response will look similar to the following partial excerpt:
{    "data": {        "fields": [            {                "name": "Sales Rep Number",                "defaultAggregation": "countDistinct",                "classifications": [                    "dimension",                    "identifier"                ],                "simplifiedClassifications": [                    "dimension"                ]            },            {                "name": "Item Number",                "defaultAggregation": "countDistinct",                "classifications": [                    "dimension",                    "identifier"                ],                "simplifiedClassifications": [                    "dimension"                ]            },            {                "name": "Customer Number",                "defaultAggregation": "countDistinct",                "classifications": [                    "dimension",                    "identifier"                ],                "simplifiedClassifications": [                    "dimension"                ]            },            {                "name": "%KEY",                "defaultAggregation": "countDistinct",                "classifications": [                    "dimension",                    "identifier"                ],                "simplifiedClassifications": [                    "dimension"                ]            },            {                "name": "Cost",                "defaultAggregation": "sum",                "classifications": [                    "measure"                ],                "simplifiedClassifications": [                    "measure"                ]            }
...
        ],        "masterItems": [            {                "classifications": [                    "measure"                ],                "caption": "Sales",                "libId": "JWaPFv",                "simplifiedClassifications": [                    "measure"                ]            },            {                "classifications": [                    "percentage"                ],                "caption": "Margin (%)",                "libId": "yygjcNr",                "simplifiedClassifications": [                    "measure"                ]            },            {                "classifications": [                    "measure"                ],                "caption": "Margin",                "libId": "VhLf",                "simplifiedClassifications": [                    "measure"                ]            },
...
        ],        "isLogicalModelEnabled": false    },    "links": {}}
If you have enabled a custom logical model in your app, the response from this endpoint will also include the following property for fields and master items which are hidden in the logical model:
"isHidden": trueIf a field or master item is set to visible in the logical
model, this property will not appear in the response.
Lesson 3: Ask natural language questions in Insight Advisor
The final two lessons cover the following endpoint:
{URL}/api/v1/apps/{appId}/insight-analyses/actions/recommend
With this API, you can specify a natural language query. To
do this, insert a simple JSON object into the Body section of
the API request. For example, to ask the question, “sales by
product group for Philadelphia,” you would insert the following
text:
{ "text": "sales by product group for Philadelphia"}When you send this type of request to the API, your response will include the following two parameters:
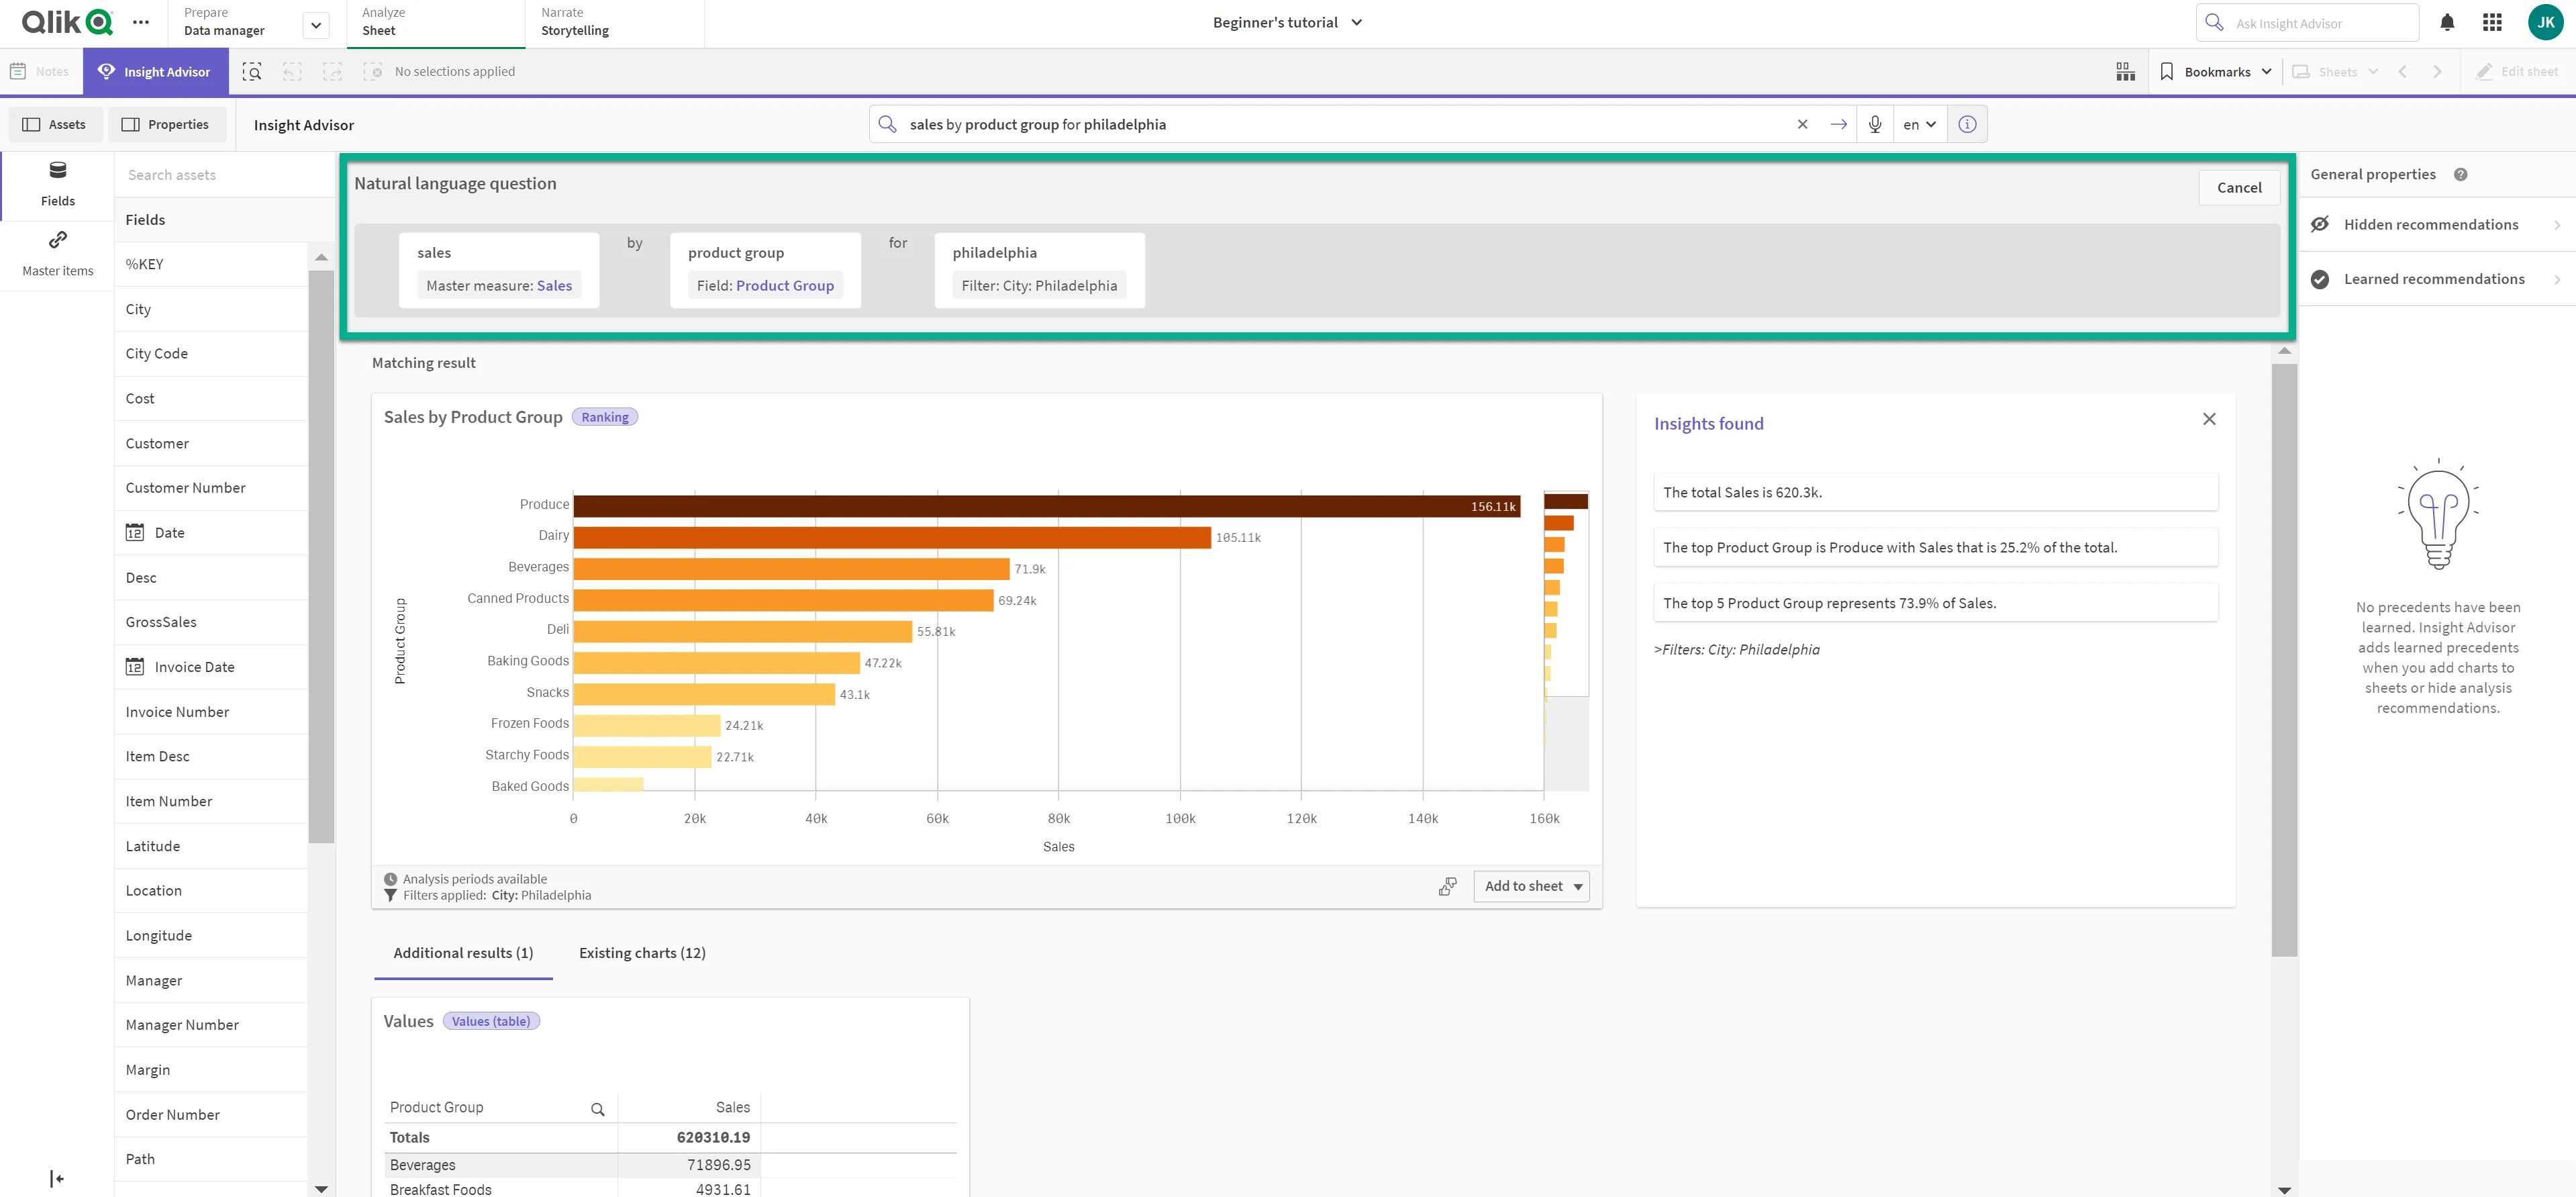
- nluInfo: Field names and other details for the fields interpreted by Insight Advisor as the subjects of the query. This is equivalent to the information in the user interface in the following image:
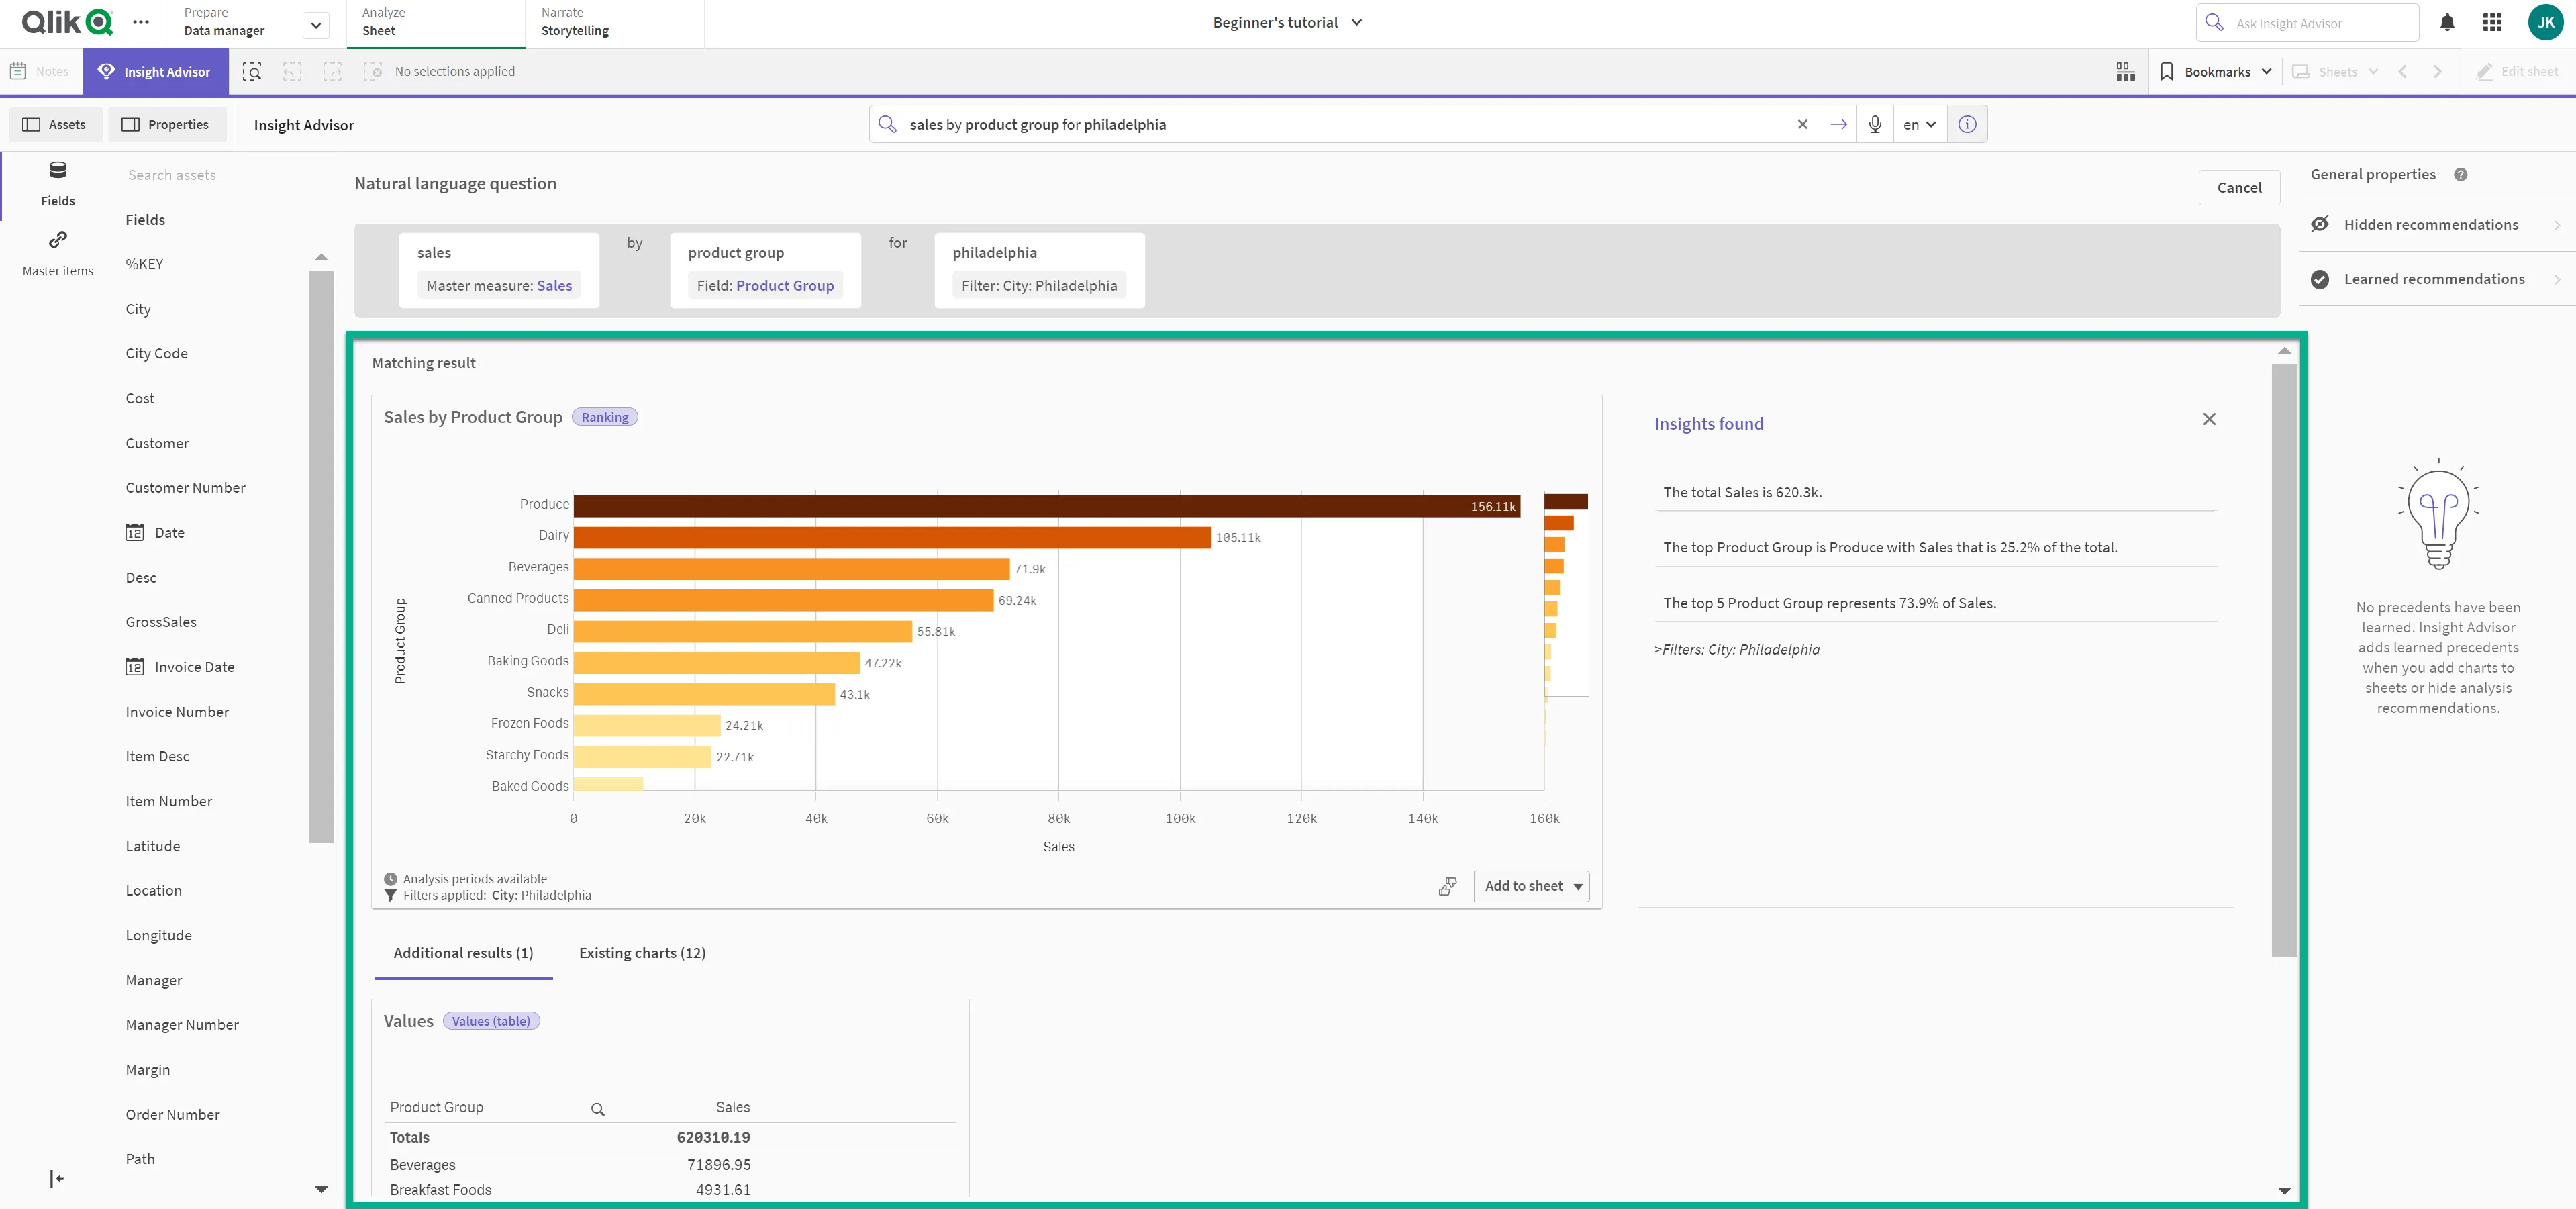
- recAnalyses: Query-specific recommendations, including analysis and chart types. This is equivalent to the following user interface elements:
The following example demonstrates the process of asking a natural language question through the API.
Re-configure Postman
- In Postman, click the plus icon to open a new tab.
- Set the HTTP method to POST.
- Under
Headers, set theContent-Typeparameter toapplication/json. - Enter the following path in the URL area:
{URL}/api/v1/apps/{appId}/insight-analyses/actions/recommendwhere {URL} is your tenant URL. Your app ID can be found in the URL in the web browser. - In the
Bodysection of the request, enter the following text to ask Insight Advisor a natural language question:
{ "text": "sales by product group for Philadelphia"}- Add the API key generated from your tenant as a Bearer Token.
- Click
Send.
The response will look similar to the following partial excerpt:
{    "data": {        "recAnalyses": [            {                "chartType": "barchart",                "options": {                    "color": {                        "auto": false,                        "mode": "byMeasure",                        "paletteColor": {                            "index": 6                        },                        "persistent": false,                        "expressionLabel": "",                        "measureScheme": "sg",                        "reverseScheme": false,                        "dimensionScheme": "12",                        "autoMinMax": true,                        "measureMin": 0,                        "measureMax": 10,                        "useBaseColors": "off",                        "expressionIsColor": false,                        "byMeasureDef": {                            "key": "={<[City]={'Philadelphia'}>} [Sales]",                            "type": "expression",                            "label": "Sales"                        }                    },                    "title": "Sales by Product Group",                    "dataPoint": {                        "show": true,                        "showLabels": true                    },                    "legend": {                        "show": false                    },                    "orientation": "horizontal",                    "qHyperCubeDef": {                        "qDimensions": [                            {                                "qDef": {                                    "qFieldDefs": [                                        "[Product Group]"                                    ],                                    "qFieldLabels": [                                        "Product Group"                                    ],                                    "cId": "dd0"                                },                                "qAttributeExpressions": [                                    {                                        "id": "colorByAlternative",                                        "matchMeasure": 0,                                        "label": "{<[City]={'Philadelphia'}>} [Sales]",                                        "qExpression": "={<[City]={'Philadelphia'}>} [Sales]"                                    }                                ]                            }                        ],                        "qMeasures": [                            {                                "qDef": {                                    "qDef": "={<[City]={'Philadelphia'}>} [Sales]",                                    "qLabel": "Sales",                                    "qLabelExpression": "",                                    "qNumFormat": {                                        "qType": "U",                                        "qnDec": 10,                                        "qUseThou": 0                                    },                                    "cId": "mm0"                                },                                "qSortBy": {                                    "qSortByNumeric": -1,                                    "qSortByLoadOrder": 1,                                    "qExpression": {}                                }                            }                        ],                        "qInterColumnSortOrder": [                            1,                            0                        ]                    },                    "components": []                },                "analysis": {                    "analysis": "rank",                    "analysisGroup": "rank",                    "title": "Sales by Product Group"                },                "relevance": 1,                "engineUri": ""            },            {                "chartType": "table",                "options": {                    "title": "Values",                    "qHyperCubeDef": {                        "qDimensions": [                            {                                "qDef": {                                    "qFieldDefs": [                                        "[Product Group]"                                    ],                                    "qFieldLabels": [                                        "Product Group"                                    ],                                    "cId": "dd0"                                },                                "qAttributeExpressions": [                                    {                                        "qExpression": "=if (mod(rowNo(),2)=0, 'white', '#F0F0F0')",                                        "id": "cellBackgroundColor",                                        "label": ""                                    }                                ]                            }                        ],                        "qMeasures": [                            {                                "qDef": {                                    "qDef": "={<[City]={'Philadelphia'}>} [Sales]",                                    "qLabel": "Sales",                                    "qLabelExpression": "",                                    "qNumFormat": {                                        "qType": "U",                                        "qnDec": 10,                                        "qUseThou": 0                                    },                                    "cId": "mm0",                                    "qAggrFunc": "Expr"                                },                                "qAttributeExpressions": [                                    {                                        "qExpression": "=if (mod(rowNo(),2)=0, 'white', '#F0F0F0')",                                        "id": "cellBackgroundColor",                                        "label": ""                                    }                                ]                            }                        ],                        "qInterColumnSortOrder": [                            0,                            1                        ],                        "columnOrder": [                            0,                            1                        ]                    },                    "components": []                },                "analysis": {                    "analysis": "values",                    "analysisGroup": "list",                    "title": "Values"                },                "relevance": 1,                "engineUri": ""            },
...
        ],        "nluInfo": [            {                "text": "sales ",                "fieldName": "Sales",                "fieldValue": "",                "role": "measure",                "type": "master_measure"            },            {                "text": "product group ",                "fieldName": "Product Group",                "fieldValue": "",                "role": "dimension",                "type": "field"            },            {                "text": "philadelphia",                "fieldName": "City",                "fieldValue": "Philadelphia",                "role": "dimension",                "type": "filter"            }        ]    }}
This response includes several of the recommended visualizations created by Insight Advisor, as well as a representation of what fields, master items, and filters were interpreted as the subjects of the question.
In this case, the most relevant recommendation is a bar chart with the Ranking analysis type, titled “Sales by Product Group.” The chart uses “Product Group” as a dimension and “Sales” as a measure. Results are filtered to only show sales for Philadelphia.
Finally, the nluInfo section confirms that the question was interpreted to be about “Sales” as a master measure, the “Product Group” as a dimension, and that the goal is to filter the “City” dimension value to only show data for “Philadelphia.”
Lesson 4: Generate analyses with Insight Advisor by specifying fields, master items, and a target analysis type
This lesson covers the second use case for this endpoint:
{URL}/api/v1/apps/{appId}/insight-analyses/actions/recommend
In addition to asking a natural language question to Insight
Advisor in Qlik Sense, you can also use this API to generate
analyses by specifying a set of fields and/or master items.
Insert field names and master item names (the latter in the
form of libIds) into the Body of the API request using the
following syntax:
{ "fields": [ { "name": "ProductName" } ], "libItems": [ { "libId": "PSXzM" } ], "targetAnalysis": { "id": "rank-rank" }}The targetAnalysis object is optional and specifies the
preferred analysis type to be included in the response.
Introduction
Create a request for analyses using specific fields
and master items. Additionally, include the optional
targetAnalysis parameter to indicate that the preferred
analysis type is Ranking.
It is important to note that the list of fields and master
items in the app’s logical model, provided by the {URL}/api/v1/apps/{appId}/insight-analyses/model
endpoint (shown in earlier example in this tutorial), will be
needed to identify the exact fields, master items,
and analysis types.
In this case, the libId value “PSXzM” represents the
pre-configured “Sales” master item. The id value
“rank-rank” represents the Ranking analysis type.
Set up Postman
- In Postman, click the plus icon to open a new tab.
- Ensure the HTTP method is set to POST.
- Enter the following path in the URL area:
{URL}/api/v1/apps/{appId}/insight-analyses/actions/recommendwhere {URL} is your tenant URL. Your app ID can be found in the URL in the web browser. - In the
Bodysection of the request, enter the following text:
{ "fields": [ { "name": "Product Group" } ], "libItems": [ { "libId": "PSXzM" } ], "targetAnalysis": { "id": "rank-rank" }}The response will look similar to the one below:
{ "data": { "recAnalyses": [ { "chartType": "barchart", "options": { "color": { "auto": false, "mode": "byMeasure", "paletteColor": { "index": 6 }, "persistent": false, "expressionLabel": "", "measureScheme": "sg", "reverseScheme": false, "dimensionScheme": "12", "autoMinMax": true, "measureMin": 0, "measureMax": 10, "useBaseColors": "off", "expressionIsColor": false, "byMeasureDef": { "key": "JWaPFv", "type": "libraryItem", "label": "Sales" } }, "title": "Sales by Product Group", "dataPoint": { "show": true, "showLabels": true }, "legend": { "show": false }, "orientation": "horizontal", "qHyperCubeDef": { "qDimensions": [ { "qDef": { "qFieldDefs": [ "[Product Group]" ], "qFieldLabels": [ "Product Group" ], "cId": "dd0" }, "qAttributeExpressions": [ { "id": "colorByAlternative", "matchMeasure": 0, "label": "JWaPFv", "qLibraryId": "JWaPFv" } ] } ], "qMeasures": [ { "qLibraryId": "JWaPFv", "qDef": { "cId": "mm0" }, "qSortBy": { "qSortByNumeric": -1, "qSortByLoadOrder": 1, "qExpression": {} } } ], "qInterColumnSortOrder": [ 1, 0 ] }, "components": [] }, "analysis": { "analysis": "rank", "analysisGroup": "rank", "title": "Sales by Product Group" }, "relevance": 0.45 } ], "nluInfo": [] }}Note that this response is significantly shorter than the
response for the natural language question from Lesson 3. The
nluInfo section is blank here, as expected.
Additionally, it was specified that a Ranking
analysis is preferred, so Insight Advisor only provided the result
with this analysis type. If you remove the targetAnalysis object,
the API response will be longer and will include more than
one analysis type.
You can also use the accept-language Header parameter in calls to this endpoint if you want your response to appear in a language other than English.
Next steps
Now that you know how to use the API with Postman, why not try building a complete web app to analyze and visualize the data. See Build a web app for the Insight Advisor API for step-by-step instructions.