Creating treemaps
Where possible, use qlik-embed and qlik/api rather than this framework.
This section describes how to create treemaps with the Visualization API.
Creating a basic treemap
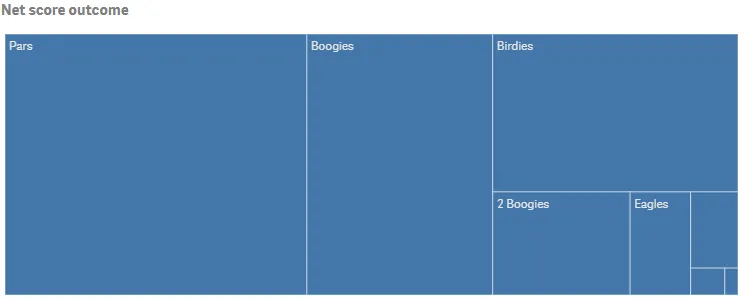
In this example, you will create a basic treemap, containing one dimension and one measure, and with a custom title.
-
Create the chart.
Create the container for the chart. The visualization type is
treemap.app.visualization.create('treemap',[],{}) -
Define the dimension.
Define the dimension as a column. Note that null values have been suppressed on the dimension.
{"qDef": {"qFieldDefs": ["NetScoreName"]},"qNullSuppression": true} -
Define the measure.
Define the measure as a column.
{"qDef": {"qFieldDefs": ["NetScoreName"]},"qNullSuppression": true},{"qDef": {"qLabel": "Frequency","qDef": "Count(NetScoreName)"}} -
Define the title.
Then define the title in the options.
{"showTitles": true,"title": "Net score outcome"}
Result
Complete code example: Treemap object
-
Visualization API
const config = {host: '<TENANT_URL>', //for example, 'abc.us.example.com'prefix: '/',port: 443,isSecure: true,webIntegrationId: '<WEB_INTEGRATION_ID>'};require.config({baseUrl: `https://${config.host}/resources`,webIntegrationId: config.webIntegrationId});require(["js/qlik"], (qlik) => {qlik.on('error', (error) => console.error(error));const app = qlik.openApp('<APP_ID>', config);app.visualization.create('treemap',[{"qDef": {"qFieldDefs": ["NetScoreName"]},"qNullSuppression": true},{"qDef": {"qLabel": "Frequency","qDef": "Count(NetScoreName)"}}],{"showTitles": true,"title": "Net score outcome"}).then((vis)=>{vis.show("QV01");});});
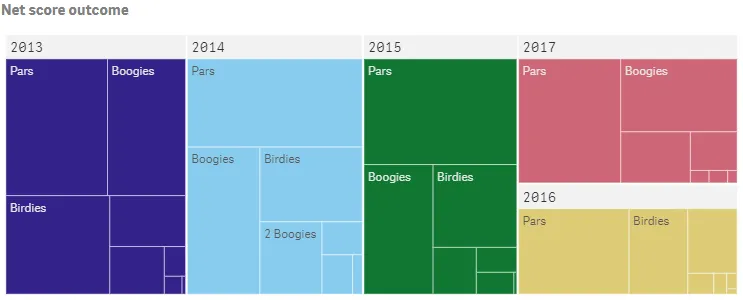
Applying additional dimensions
To make full use of the treemap, it is preferable to have two or three dimensions. Using more than two or three dimensions is not recommended because the treemap may become unmanageable.
In this example, you will add a second dimension (Year).
-
Define the second dimension.
Define the new dimension (
Year) as a column and place it before the existing one (NetScoreName). Note that null values have been suppressed on both dimensions.{"qDef": {"qFieldDefs": ["Date.autoCalendar.Year"],"qFieldLabels": ["Year"]},"qNullSuppression": true},{"qDef": {"qFieldDefs": ["NetScoreName"]},"qNullSuppression": true}
Result
Example treemap object with additional dimensions and color modifiers
Complete code example: Treemap object with additional dimensions and color modifiers
-
Visualization API
const config = {host: '<TENANT_URL>', //for example, 'abc.us.example.com'prefix: '/',port: 443,isSecure: true,webIntegrationId: '<WEB_INTEGRATION_ID>'};require.config({baseUrl: `https://${config.host}/resources`,webIntegrationId: config.webIntegrationId});require(["js/qlik"], (qlik) => {qlik.on('error', (error) => console.error(error));const app = qlik.openApp('<APP_ID>', config);app.visualization.create('treemap',[{"qDef": {"qFieldDefs": ["Date.autoCalendar.Year"],"qFieldLabels": ["Year"]},"qNullSuppression": true},{"qDef": {"qFieldDefs": ["NetScoreName"]},"qNullSuppression": true},{"qDef": {"qLabel": "Frequency","qDef": "Count(NetScoreName)"}}],{"showTitles": true,"title": "Net score outcome"}).then((vis)=>{vis.show("QV01");});});
Coloring by dimension
In this example, you will color the treemap by one of the dimensions. When you color a visualization by a dimension, all values in the visualization are colored by the corresponding values in the dimension field selected.
-
Set the color mode
Color by dimension is turned on in the color object in the options. Disable auto coloring by setting
"auto": false. Then set"mode": "byDimension"to color by dimension.{"showTitles": true,"title": "Net score outcome","color": {"auto": false,"mode": "byDimension"}} -
Define the dimension and set the color palette.
Define the dimension to color by:
"byDimDef": { "key": "NetScoreName" }.Then select the color palette to apply to the visualization:"dimensionScheme": "12".{"showTitles": true,"title": "Net score outcome","color": {"auto": false,"mode": "byDimension","dimensionScheme": "12","byDimDef": {"key": "NetScoreName"}}} -
Additional color settings.
Set
"persistent": trueto use persistent colors on data points between selections.If you color by a master dimension, that is, a dimension that is stored in the library, you may want to use the colors defined for the master dimension. If so, you set
"useDimColVal": true.{"showTitles": true,"title": "Net score outcome","color": {"auto": false,"mode": "byDimension","useDimColVal": true,"persistent": true,"dimensionScheme": "12","byDimDef": {"key": "NetScoreName"}}} -
Define qAttributeDimensions.
When coloring by dimension, you must define
qAttributeDimensionsfor the dimension to color by:"qAttributeDimensions": [ { "qDef": "NetScoreName","id": "colorByAlternative", "label": "Year" } ].{"qDef": {"qFieldDefs": ["NetScoreName"]},"qNullSuppression": true,"qAttributeDimensions": [{"qDef": "NetScoreName","id": "colorByAlternative","label": "Year"}]}
Result
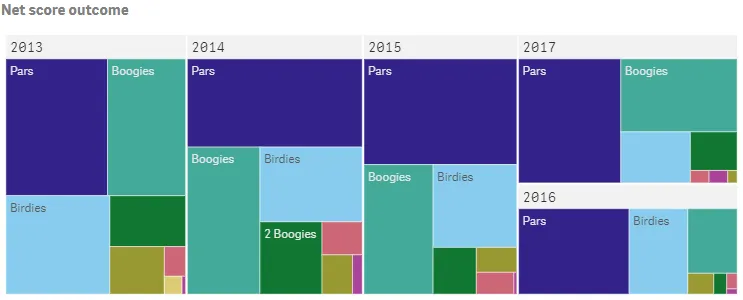
Complete code example: Treemap object with more detailed color modifiers by dimension and measure
-
Visualization API
const config = {host: '<TENANT_URL>', //for example, 'abc.us.example.com'prefix: '/',port: 443,isSecure: true,webIntegrationId: '<WEB_INTEGRATION_ID>'};require.config({baseUrl: `https://${config.host}/resources`,webIntegrationId: config.webIntegrationId});require(["js/qlik"], (qlik) => {qlik.on('error', (error) => console.error(error));const app = qlik.openApp('<APP_ID>', config);app.visualization.create('treemap',[{"qDef": {"qFieldDefs": ["Date.autoCalendar.Year"],"qFieldLabels": ["Year"]},"qNullSuppression": true},{"qDef": {"qFieldDefs": ["NetScoreName"]},"qNullSuppression": true,"qAttributeDimensions": [{"qDef": "NetScoreName","id": "colorByAlternative","label": "Year"}]},{"qDef": {"qLabel": "Frequency","qDef": "Count(NetScoreName)"}}],{"showTitles": true,"title": "Net score outcome","color": {"auto": false,"mode": "byDimension","useDimColVal": true,"persistent": true,"dimensionScheme": "12","byDimDef": {"key": "NetScoreName"}}}).then((vis)=>{vis.show("QV01");});});
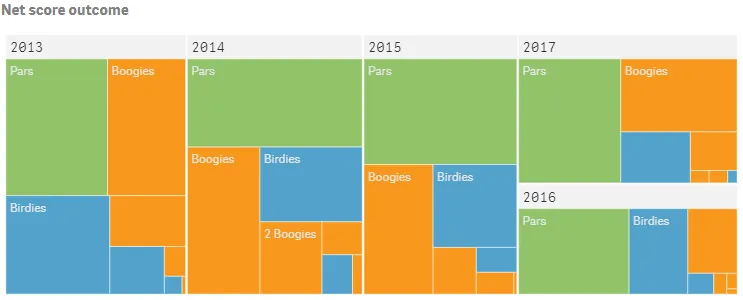
Coloring by expression
Coloring by expression applies colors to a visualization based on a user-defined expression. This enables you to use expressions to define both the colors used and the values upon which the colors are applied in a visualization. Supported formats for color expressions are: RGB, ARGB, and HSL.
-
Set the color mode.
Color by expression is then turned on in the color object in the options. Disable auto coloring by setting
"auto": false. Then set"mode": "byExpression"to color by expression.{"showTitles": true,"title": "Net score outcome","color": {"auto": false,"mode": "byExpression"}} -
Define color expression.
Define that the expression is a color code:
"expressionIsColor": true. Then define the color expression used:"colorExpression":"If(NetScoreDiff<0,RGB(82, 162, 204),If(NetScoreDiff>0,RGB(248, 152, 29),RGB(145, 194, 106)))".{"showTitles": true,"title": "Net score outcome","color": {"auto": false,"mode": "byExpression","expressionIsColor": true,"colorExpression": "If(NetScoreDiff<0,RGB(82, 162, 204),If(NetScoreDiff>0,RGB(248, 152, 29),RGB(145, 194, 106)))"},"legend": {"show": false}} -
Define qAttributeExpressions
When coloring by expression you must define
qAttributeExpressionsfor the first measure:"qAttributeExpressions": [ { "qExpression":"If(NetScoreDiff<0,RGB(82, 162, 204),If(NetScoreDiff>0,RGB(248, 152, 29),RGB(145, 194, 106)))", "id": "colorByExpression" } ].{"qDef": {"qLabel": "Frequency","qDef": "Count(NetScoreName)"},"qAttributeExpressions": [{"qExpression": "If(NetScoreDiff<0,RGB(82, 162, 204),If(NetScoreDiff>0,RGB(248, 152, 29),RGB(145, 194, 106)))","id": "colorByExpression"}]}
Result
Example treemap object colored by expression
Complete code example: Treemap object colored by expression
-
Visualization API
const config = {host: '<TENANT_URL>', //for example, 'abc.us.example.com'prefix: '/',port: 443,isSecure: true,webIntegrationId: '<WEB_INTEGRATION_ID>'};require.config({baseUrl: `https://${config.host}/resources`,webIntegrationId: config.webIntegrationId});require(["js/qlik"], (qlik) => {qlik.on('error', (error) => console.error(error));const app = qlik.openApp('<APP_ID>', config);app.visualization.create('treemap',[{"qDef": {"qFieldDefs": ["Date.autoCalendar.Year"],"qFieldLabels": ["Year"]},"qNullSuppression": true},{"qDef": {"qFieldDefs": ["NetScoreName"]},"qNullSuppression": true},{"qDef": {"qLabel": "Frequency","qDef": "Count(NetScoreName)"},"qAttributeExpressions": [{"qExpression": "If(NetScoreDiff<0,RGB(82, 162, 204),If(NetScoreDiff>0,RGB(248, 152, 29),RGB(145, 194, 106)))","id": "colorByExpression"}]}],{"showTitles": true,"title": "Net score outcome","color": {"auto": false,"mode": "byExpression","useBaseColors": "off","expressionIsColor": true,"colorExpression": "If(NetScoreDiff<0,RGB(82, 162, 204),If(NetScoreDiff>0,RGB(248, 152, 29),RGB(145, 194, 106)))"},"legend": {"show": false}}).then((vis)=>{vis.show("QV01");});});