Creating pivot tables
Where possible, use qlik-embed and qlik/api rather than this framework.
This section describes how to create pivot tables with the Visualization API.
Creating a basic pivot table
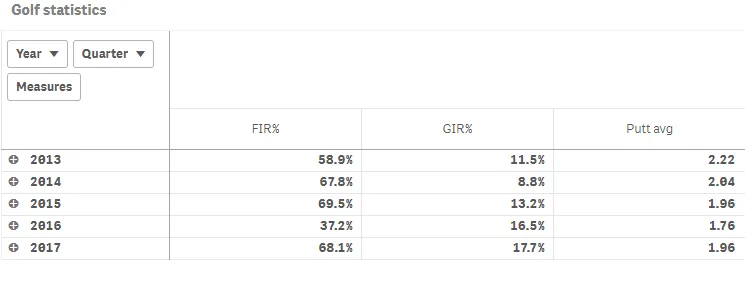
In this example, you will create a basic pivot table, containing two dimensions (Year and Quarter) and three measures. The measures have basic number formatting applied and a title is added to the pivot table.
-
Create the chart.
Create the container for the chart. The visualization type is pivot-table.
app.visualization.create('pivot-table',[],{}) -
Define the first dimension.
Define the dimension Year as a column. Note that the dimension does not include null values:
"qNullSuppression": true.{"qDef": {"qFieldDefs": ["Date.autoCalendar.Year"],"qFieldLabels": ["Year"]},"qNullSuppression": true} -
Define the second dimension.
Define the dimension
Quarteras a column. Note that the dimension does not include null values:"qNullSuppression": true.{"qDef": {"qFieldDefs": ["Date.autoCalendar.Year"],"qFieldLabels": ["Year"]},"qNullSuppression": true},{"qDef": {"qFieldDefs": ["Date.autoCalendar.Quarter"],"qFieldLabels": ["Quarter"]},"qNullSuppression": true} -
Define the first measure.
Define the measure as a column and label it
FIR%. Apply custom number formatting since the measure should be displayed in percent.{"qDef": {"qLabel": "FIR%","qDef": "Avg(FwHit)","qNumFormat": {"qType": "F","qnDec": 2,"qUseThou": 0,"qFmt": "0.0%","qDec": ".","qThou": ","}}} -
Define the second measure.
Define the measure as a column and label it
GIR%. Apply custom number formatting since the measure should be displayed in percent.{"qDef": {"qLabel": "FIR%","qDef": "Avg(FwHit)","qNumFormat": {"qType": "F","qnDec": 2,"qUseThou": 0,"qFmt": "0.0%","qDec": ".","qThou": ","}}},{"qDef": {"qLabel": "GIR%","qDef": "Avg(GIR)","qNumFormat": {"qType": "F","qnDec": 2,"qUseThou": 0,"qFmt": "0.0%","qDec": ".","qThou": ","}}} -
Define the third measure.
Define the measure as a column and label it
Putt avg. Apply custom number formatting since the measure should be displayed with two decimals.{"qDef": {"qLabel": "FIR%","qDef": "Avg(FwHit)","qNumFormat": {"qType": "F","qnDec": 2,"qUseThou": 0,"qFmt": "0.0%","qDec": ".","qThou": ","}}},{"qDef": {"qLabel": "GIR%","qDef": "Avg(GIR)","qNumFormat": {"qType": "F","qnDec": 2,"qUseThou": 0,"qFmt": "0.0%","qDec": ".","qThou": ","}}},{"qDef": {"qLabel": "Putt avg","qDef": "Avg(Putts)","qNumFormat": {"qType": "F","qnDec": 2,"qUseThou": 0,"qFmt": "#,##0.00","qDec": ".","qThou": ","}}} -
Define the title.
The title is defined in the options.
{"showTitles": true,"title": "Golf statistics"}
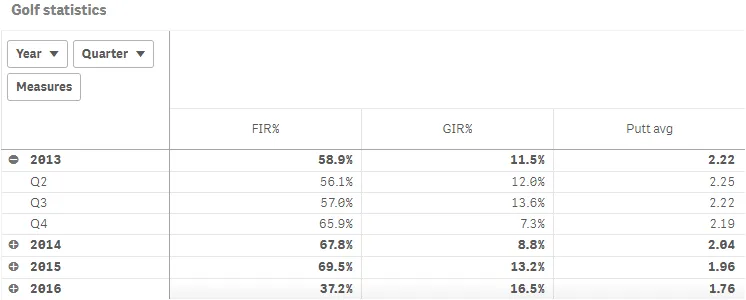
Result
The image below shows the same example with year 2013 expanded.
Complete code example: Basic pivot table
-
Visualization API
const config = {host: '<TENANT_URL>', //for example, 'abc.us.example.com'prefix: '/',port: 443,isSecure: true,webIntegrationId: '<WEB_INTEGRATION_ID>'};require.config({baseUrl: `https://${config.host}/resources`,webIntegrationId: config.webIntegrationId});require(["js/qlik"], (qlik) => {qlik.on('error', (error) => console.error(error));const app = qlik.openApp('<APP_ID>', config);app.visualization.create('pivot-table',[{"qDef": {"qFieldDefs": ["Date.autoCalendar.Year"],"qFieldLabels": ["Year"]},"qNullSuppression": true},{"qDef": {"qFieldDefs": ["Date.autoCalendar.Quarter"],"qFieldLabels": ["Quarter"]},"qNullSuppression": true},{"qDef": {"qLabel": "FIR%","qDef": "Avg(FwHit)","qNumFormat": {"qType": "F","qnDec": 2,"qUseThou": 0,"qFmt": "0.0%","qDec": ".","qThou": ","}}},{"qDef": {"qLabel": "GIR%","qDef": "Avg(GIR)","qNumFormat": {"qType": "F","qnDec": 2,"qUseThou": 0,"qFmt": "0.0%","qDec": ".","qThou": ","}}},{"qDef": {"qLabel": "Putt avg","qDef": "Avg(Putts)","qNumFormat": {"qType": "F","qnDec": 2,"qUseThou": 0,"qFmt": "#,##0.00","qDec": ".","qThou": ","}}}],{"showTitles": true,"title": "Golf statistics"}).then((vis)=>{vis.show("QV01");});});
Adding totals row
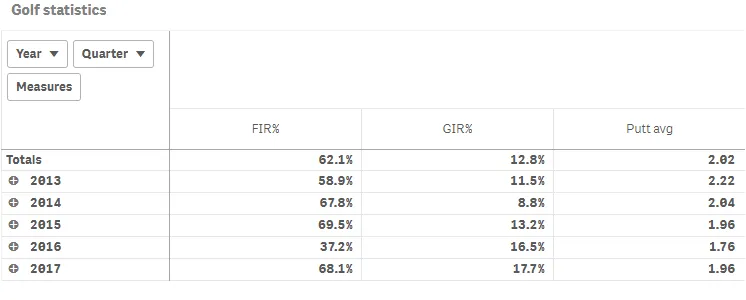
In this example, you will add a totals row to the pivot table. This is enabled
in the qOtherTotalSpec object of the first dimension.
-
Add the totals row.
Add the totals row in the column definition of the first dimension (Year):
"qOtherTotalSpec": { "qTotalMode": "TOTAL_EXPR" }. This means that the total of the dimension values is returned.{"qDef": {"qFieldDefs": ["Date.autoCalendar.Year"],"qFieldLabels": ["Year"]},"qNullSuppression": true,"qOtherTotalSpec": {"qTotalMode": "TOTAL_EXPR"}}, -
Add the label.
Next, add a label for the totals row:
"qTotalLabel": { "qv": "Totals" }.{"qDef": {"qFieldDefs": ["Date.autoCalendar.Year"],"qFieldLabels": ["Year"]},"qNullSuppression": true,"qOtherTotalSpec": {"qTotalMode": "TOTAL_EXPR"},"qTotalLabel": {"qv": "Totals"}},
Result
Complete code example: Pivot table with totals row
-
Visualization API
const config = {host: '<TENANT_URL>', //for example, 'abc.us.example.com'prefix: '/',port: 443,isSecure: true,webIntegrationId: '<WEB_INTEGRATION_ID>'};require.config({baseUrl: `https://${config.host}/resources`,webIntegrationId: config.webIntegrationId});require(["js/qlik"], (qlik) => {qlik.on('error', (error) => console.error(error));const app = qlik.openApp('<APP_ID>', config);app.visualization.create('pivot-table',[{"qDef": {"qFieldDefs": ["Date.autoCalendar.Year"],"qFieldLabels": ["Year"]},"qNullSuppression": true,"qOtherTotalSpec": {"qTotalMode": "TOTAL_EXPR"},"qTotalLabel": {"qv": "Totals"}},{"qDef": {"qFieldDefs": ["Date.autoCalendar.Quarter"],"qFieldLabels": ["Quarter"]},"qNullSuppression": true},{"qDef": {"qLabel": "FIR%","qDef": "Avg(FwHit)","qNumFormat": {"qType": "F","qnDec": 2,"qUseThou": 0,"qFmt": "0.0%","qDec": ".","qThou": ","}}},{"qDef": {"qLabel": "GIR%","qDef": "Avg(GIR)","qNumFormat": {"qType": "F","qnDec": 2,"qUseThou": 0,"qFmt": "0.0%","qDec": ".","qThou": ","}}},{"qDef": {"qLabel": "Putt avg","qDef": "Avg(Putts)","qNumFormat": {"qType": "F","qnDec": 2,"qUseThou": 0,"qFmt": "#,##0.00","qDec": ".","qThou": ","}}}],{"showTitles": true,"title": "Golf statistics"}).then((vis)=>{vis.show("QV01");});});
Using background color and text color
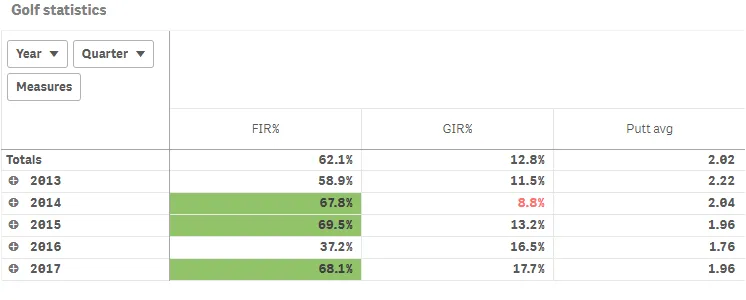
In this example, you will use expressions to color the cell backgrounds and the text in your pivot table. This enables you to use expressions to define both the colors used and the conditional values upon which the colors are applied in a visualization.
Background colors and text colors are defined in the qAttributeExpressions
object inside the applicable measure definition in the columns. The
qAttributeExpressions object consists of two arrays, where the first array is
for defining the background color and the second array is for defining the text color.
-
Set a background color for the first measure.
You will add a background color to the first measure:
"qAttributeExpressions":[{ "qExpression": "If(Avg(FwHit)>0.667, RGB(145, 194, 106))" }, {} ]. This will color the cell green for values that are greater than 66.7%.{"qDef": {"qLabel": "FIR%","qDef": "Avg(FwHit)","qNumFormat": {"qType": "F","qnDec": 2,"qUseThou": 0,"qFmt": "0.0%","qDec": ".","qThou": ","}},"qAttributeExpressions": [{"qExpression": "If(Avg(FwHit)>0.667, RGB(145, 194, 106))"},{}]}, -
Set a text color for the second measure.
Next, you will add a text color to the second measure:
"qAttributeExpressions":[ {}, { "qExpression":"If(Avg(GIR)<0.1,RGB(255, 115, 115))" } ]. This will color the text red for values that are below 10%.{"qDef": {"qLabel": "GIR%","qDef": "Avg(GIR)","qNumFormat": {"qType": "F","qnDec": 2,"qUseThou": 0,"qFmt": "0.0%","qDec": ".","qThou": ","}},"qAttributeExpressions": [{},{"qExpression": "If(Avg(GIR)<0.1,RGB(255, 115, 115))"}]},
Result
Complete code example: Background color and text color
-
Visualization API
const config = {host: '<TENANT_URL>', //for example, 'abc.us.example.com'prefix: '/',port: 443,isSecure: true,webIntegrationId: '<WEB_INTEGRATION_ID>'};require.config({baseUrl: `https://${config.host}/resources`,webIntegrationId: config.webIntegrationId});require(["js/qlik"], (qlik) => {qlik.on('error', (error) => console.error(error));const app = qlik.openApp('<APP_ID>', config);app.visualization.create('pivot-table',[{"qDef": {"qFieldDefs": ["Date.autoCalendar.Year"],"qFieldLabels": ["Year"]},"qNullSuppression": true,"qOtherTotalSpec": {"qTotalMode": "TOTAL_EXPR"},"qTotalLabel": {"qv": "Totals"}},{"qDef": {"qFieldDefs": ["Date.autoCalendar.Quarter"],"qFieldLabels": ["Quarter"]},"qNullSuppression": true},{"qDef": {"qLabel": "FIR%","qDef": "Avg(FwHit)","qNumFormat": {"qType": "F","qnDec": 2,"qUseThou": 0,"qFmt": "0.0%","qDec": ".","qThou": ","}},"qAttributeExpressions": [{"qExpression": "If(Avg(FwHit)>0.667, RGB(145, 194, 106))"},{}]},{"qDef": {"qLabel": "GIR%","qDef": "Avg(GIR)","qNumFormat": {"qType": "F","qnDec": 2,"qUseThou": 0,"qFmt": "0.0%","qDec": ".","qThou": ","}},"qAttributeExpressions": [{},{"qExpression": "If(Avg(GIR)<0.1,RGB(255, 115, 115))"}]},{"qDef": {"qLabel": "Putt avg","qDef": "Avg(Putts)","qNumFormat": {"qType": "F","qnDec": 2,"qUseThou": 0,"qFmt": "#,##0.00","qDec": ".","qThou": ","}}}],{"showTitles": true,"title": "Golf statistics"}).then((vis)=>{vis.show("QV01");});});