Creating KPIs
Where possible, use qlik-embed and qlik/api rather than this framework.
This section describes how to create KPIs with the Visualization API.
Creating a basic KPI
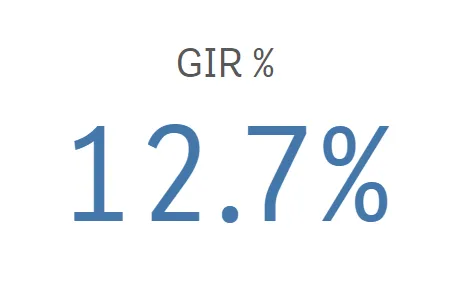
In this example, you will create a basic KPI, containing a single measure. Measure titles are displayed in the visualization by default.
-
Create the chart.
Create the container for the chart. The visualization type is
kpi.app.visualization.create('kpi',[],{}) -
Define the measure.
Define the measure as a column. Note that the number formatting is defined to display the value as a percentage.
NoteIn a KPI visualization, you can have one or two measures and no dimensions.
[{"qDef": {"qLabel": "GIR %","qDef": "Avg(GIR)","qNumFormat": {"qType": "F","qnDec": 2,"qUseThou": 0,"qFmt": "0.0%","qDec": ".","qThou": ","}}}] -
Style the text
Since measure titles are displayed by default,
"showMeasureTitle": truecan be omitted. Visualization titles are therefore turned off by default, which means that"showTitles": falsecan also be omitted.In this example, you will select to center align the text and use large font size.
{"showTitles": false,"showMeasureTitle": true,"textAlign": "center","fontSize": "L"}
Result
Complete code example: Basic KPI
-
Visualization API
const config = {host: '<TENANT_URL>', //for example, 'abc.us.example.com'prefix: '/',port: 443,isSecure: true,webIntegrationId: '<WEB_INTEGRATION_ID>'};require.config({baseUrl: `https://${config.host}/resources`,webIntegrationId: config.webIntegrationId});require(["js/qlik"], (qlik) => {qlik.on('error', (error) => console.error(error));const app = qlik.openApp('<APP_ID>', config);app.visualization.create('kpi',[{"qDef": {"qLabel": "GIR %","qDef": "Avg(GIR)","qNumFormat": {"qType": "F","qnDec": 2,"qUseThou": 0,"qFmt": "0.0%","qDec": ".","qThou": ","}}}],{"showTitles": false,"showMeasureTitle": true,"textAlign": "center","fontSize": "L"}).then((vis)=>{vis.show("QV01");});});
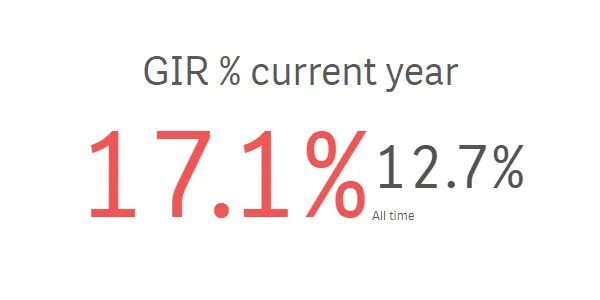
Using two measures with different colors
In this example, you will add a second measure, where the second value automatically becomes a complementary value and is shown with a smaller font size. You will also apply different colors to the two measures.
-
Define the first measure.
Define the measure as a column. The first measure is defined to display the current year value as a percentage.
{"qDef": {"qLabel": "GIR % current year","qDef": "Avg({<[Date.autoCalendar.YearsAgo]={'3'}>}GIR)","qNumFormat": {"qType": "F","qnDec": 2,"qUseThou": 0,"qFmt": "0.0%","qDec": ".","qThou": ","}}} -
Define the second measure.
Define the measure as a column. The second measure is to display the all time value as a percentage.
{"qDef": {"qLabel": "GIR % current year","qDef": "Avg({<[Date.autoCalendar.YearsAgo]={'3'}>}GIR)","qNumFormat": {"qType": "F","qnDec": 2,"qUseThou": 0,"qFmt": "0.0%","qDec": ".","qThou": ","}}},{"qDef": {"qLabel": "All time","qDef": "Avg(GIR)","qNumFormat": {"qType": "F","qnDec": 2,"qUseThou": 0,"qFmt": "0.0%","qDec": ".","qThou": ","}}} -
Coloring the first measure.
The first measure is to be displayed in the color #f05555, which is not in the default color palette. The following is added to the column definition for the first measure.
"conditionalColoring": {"paletteSingleColor": {"index": -1,"color": "#f05555"}} -
Coloring the second measure.
The second measure is to be displayed in the color #545352, defined in the default color palette as
"index": 14. The following is added to the column definition for the second measure."conditionalColoring": {"paletteSingleColor": {"index": 14,"color": "#545352"}}
Result
Complete code example: Two measures with different colors
-
Visualization API
const config = {host: '<TENANT_URL>', //for example, 'abc.us.example.com'prefix: '/',port: 443,isSecure: true,webIntegrationId: '<WEB_INTEGRATION_ID>'};require.config({baseUrl: `https://${config.host}/resources`,webIntegrationId: config.webIntegrationId});require(["js/qlik"], (qlik) => {qlik.on('error', (error) => console.error(error));const app = qlik.openApp('<APP_ID>', config);app.visualization.create('kpi',[{"qDef": {"qLabel": "GIR % current year","qDef": "Avg({<[Date.autoCalendar.YearsAgo]={'3'}>}GIR)","qNumFormat": {"qType": "F","qnDec": 2,"qUseThou": 0,"qFmt": "0.0%","qDec": ".","qThou": ","},"conditionalColoring": {"paletteSingleColor": {"index": -1,"color": "#f05555"}}}},{"qDef": {"qLabel": "All time","qDef": "Avg(GIR)","qNumFormat": {"qType": "F","qnDec": 2,"qUseThou": 0,"qFmt": "0.0%","qDec": ".","qThou": ","},"conditionalColoring": {"paletteSingleColor": {"index": 14,"color": "#545352"}}}}],{"showTitles": false,"showMeasureTitle": true,"textAlign": "center","fontSize": "L"}).then((vis)=>{vis.show("QV01");});});
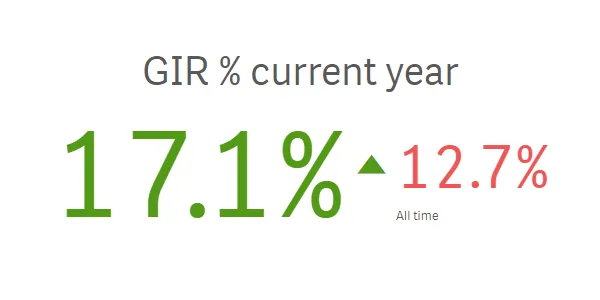
Using conditional colors and symbols
When you use conditional colors for your KPI visualization, you have the option to use symbols to be displayed next to your measure value. In this example, conditional coloring is used on the first measure. Two color segments are defined where different colors are used for values greater than and less than the defined limit.
You can also add symbols to the values. In this example, Arrow down is defined as a symbol for values less than the limit and Arrow up is defined as a symbol for values greater than the limit.
-
Enable conditional coloring.
Conditional colors is defined in the
conditionalColoringobject. You will enable conditional coloring for the first measure:"conditionalColoring": {"useConditionalColoring": true} -
Define the color segment limit.
Define the limit in the
segmentsobject to use two color segments. The limit is an expression: Avg(GIR)."conditionalColoring": {"useConditionalColoring": true,"segments": {"limits": [{"value": {"qValueExpression": {"qExpr": "Avg(GIR)"}},"gradient": false}]}} -
Define segment colors and icons.
The two color segments greater than and less than the limit specified in the previous step, are defined in the
paletteColorsobject. You will define different colors and icons for the segments: Arrow down is defined as a symbol for values less than the limit and Arrow up is defined as a symbol for values greater than the limit."conditionalColoring": {"useConditionalColoring": true,"segments": {"limits": [{"value": {"qValueExpression": {"qExpr": "Avg(GIR)"}},"gradient": false}],"paletteColors": [{"color": "#ae5798","icon": "S","index": -1},{"color": "#529a18","icon": "R","index": -1}]}} -
Coloring the second measure.
Single color is used on the second measure. In this example, a shade of the color red (#f05555) is used:
"conditionalColoring": {"useConditionalColoring": false,"singleColor": 3,"paletteSingleColor": {"index": -1,"color": "#f05555"}}
Result
Complete code example: Conditional colors and symbols
-
Visualization API
const config = {host: '<TENANT_URL>', //for example, 'abc.us.example.com'prefix: '/',port: 443,isSecure: true,webIntegrationId: '<WEB_INTEGRATION_ID>'};require.config({baseUrl: `https://${config.host}/resources`,webIntegrationId: config.webIntegrationId});require(["js/qlik"], (qlik) => {qlik.on('error', (error) => console.error(error));const app = qlik.openApp('<APP_ID>', config);app.visualization.create('kpi',[{"qDef": {"qLabel": "GIR % current year","qDef": "Avg({<[Date.autoCalendar.YearsAgo]={'3'}>}GIR)","qNumFormat": {"qType": "F","qnDec": 2,"qUseThou": 0,"qFmt": "0.0%","qDec": ".","qThou": ","},"conditionalColoring": {"useConditionalColoring": true,"segments": {"limits": [{"value": {"qValueExpression": {"qExpr": "Avg(GIR)"}},"gradient": false}],"paletteColors": [{"color": "#ae5798","icon": "S","index": -1},{"color": "#529a18","icon": "R","index": -1}]}}}},{"qDef": {"qLabel": "All time","qDef": "Avg(GIR)","qNumFormat": {"qType": "F","qnDec": 2,"qUseThou": 0,"qFmt": "0.0%","qDec": ".","qThou": ","},"conditionalColoring": {"useConditionalColoring": false,"singleColor": 3,"paletteSingleColor": {"index": -1,"color": "#f05555"}}}}],{"showTitles": false,"showMeasureTitle": true,"textAlign": "center","fontSize": "L"}).then((vis)=>{vis.show("QV01");});});