Creating gauges
Where possible, use qlik-embed and qlik/api rather than this framework.
This section describes how to create gauges with the Visualization API.
Creating a basic radial gauge
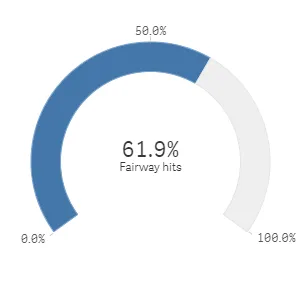
In this example, you will create a basic radial gauge, containing one measure, with the titles switched off and a custom range.
-
Create the chart Create the container for the chart. The visualization type is gauge.
app.visualization.create('gauge',[],{}) -
Define the measure.
Define the measure as a column. Note that the value of the measure is to be displayed in percent.
NoteIn a gauge, you can only have one measure and no dimensions.
[{"qDef": {"qFieldDefs": ["=NetScoreName"],"qFieldLabels": ["Net result"]},"qNullSuppression": true},{"qDef": {"qLabel": "Occurancies","qDef": "Count(HoID)","qNumFormat": {"qType": "F","qnDec": 2,"qUseThou": 0}}}] -
Disable the title in the options.
Since the label of the measure by default is visible in the gauge visualization, you can switch off the titles.
{"showTitles": false} -
Set the range limit.
Set a maximum range limit value of the measure to be equal to 100 percent, that is, “max”: 1.
"measureAxis": {"min": 0,"max": 1} -
Define the gauge type.
Since radial gauges are the default gauge type, “gaugetype”: “radial” can be omitted from the definition, but it is being kept in this example.
Result
Complete code example: Basic radial gauge
-
Visualization API
const config = {host: '<TENANT_URL>', //for example, 'abc.us.example.com'prefix: '/',port: 443,isSecure: true,webIntegrationId: '<WEB_INTEGRATION_ID>'};require.config({baseUrl: `https://${config.host}/resources`,webIntegrationId: config.webIntegrationId});require(["js/qlik"], (qlik) => {qlik.on('error', (error) => console.error(error));const app = qlik.openApp('<APP_ID>', config);app.visualization.create('gauge',[{"qDef": {"qLabel": "Fairway hits","qDef": "Avg(FwHit)","qNumFormat": {"qType": "F","qnDec": 2,"qUseThou": 0,"qFmt": "0.0%","qDec": ".","qThou": ","}}}],{"showTitles": false,"measureAxis": {"min": 0,"max": 1},"gaugetype": "radial"}).then((vis)=>{vis.show("QV01");});});
Presentation and color settings
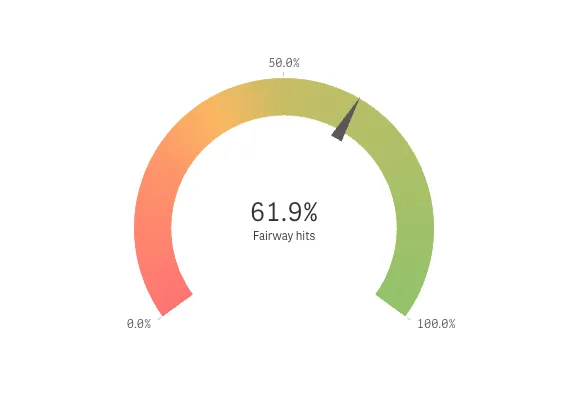
In this example, you will change the way the gauge is presented by adding gradient color segments and reducing the arc size. All these changes are set in the options.
-
Add color segments.
Enable the usage of segments:
"useSegments": true. Changes to the color segments are then set in thesegmentInfoobject.In this example, you will split the gauge into three color segments: 0 - 0.25, 0.25 - 0.5, and 0.5 - 1.
To achieve this, first set the measure axis value range.
"measureAxis": {"min": 0,"max": 1}Then add two segment limits to split the range into three segments. Note that the color segments are defined to be gradient.
"segmentInfo": {"limits": [{"value": 0.25,"gradient": true},{"value": 0.5,"gradient": true}]} -
Define the colors for the segments.
Define the colors to be used for the three segments by adding a
paletteColorsobject inside thesegmentInfoobject. Add a color for the first segment, that is, for values between measure axis minimum and the first segment limit. Then add a color for the second segment, that is, for values between the first and the second limit. Finally, add a color for the third segment, which are for values between the second segment limit and the measure axis maximum."paletteColors": [/*color for the first segment*/{"color": "#ff7373","index": -1},/*color for the second segment*/{"color": "#fab761","index": -1},/*color for the third segment*/{"color": "#91c26a","index": -1}]
Result
Complete code example: Presentation and color settings
-
Visualization API
const config = {host: '<TENANT_URL>', //for example, 'abc.us.example.com'prefix: '/',port: 443,isSecure: true,webIntegrationId: '<WEB_INTEGRATION_ID>'};require.config({baseUrl: `https://${config.host}/resources`,webIntegrationId: config.webIntegrationId});require(["js/qlik"], (qlik) => {qlik.on('error', (error) => console.error(error));const app = qlik.openApp('<APP_ID>', config);app.visualization.create('gauge',[{"qDef": {"qLabel": "Fairway hits","qDef": "Avg(FwHit)","qNumFormat": {"qType": "F","qnDec": 2,"qUseThou": 0,"qFmt": "0.0%","qDec": ".","qThou": ","}}}],{"showTitles": false,"measureAxis": {"min": 0,"max": 1},"gaugetype": "radial","useSegments": true,"segmentInfo": {"limits": [{"value": 0.25,"gradient": true},{"value": 0.5,"gradient": true}],"paletteColors": [{"color": "#ff7373","index": -1},{"color": "#fab761","index": -1},{"color": "#91c26a","index": -1}]}}).then((vis)=>{vis.show("QV01");});});
Horizontal and vertical bars
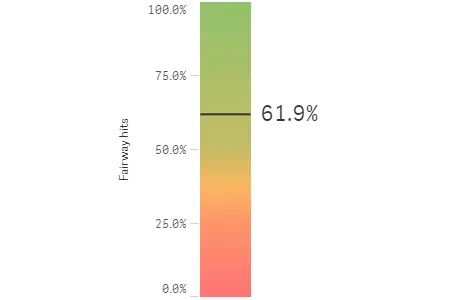
In this example, you want the gauge visualizations to be displayed as a vertical bar.
-
Change the gauge type.
To display the gauge as a bar, set
"gaugetype"in the options.{"gaugetype": "bar"} -
Set vertical orientation.
Bars are by default presented with horizontal orientation. In this example, you will set vertical orientation. First, turn off auto orientation:
"autoOrientation": falseand then set"orientation": "vertical".{"gaugetype": "bar","autoOrientation": false,"orientation": "vertical"}
Result
Complete code example: Horizontal and vertical bars
-
Visualization API
const config = {host: '<TENANT_URL>', //for example, 'abc.us.example.com'prefix: '/',port: 443,isSecure: true,webIntegrationId: '<WEB_INTEGRATION_ID>'};require.config({baseUrl: `https://${config.host}/resources`,webIntegrationId: config.webIntegrationId});require(["js/qlik"], (qlik) => {qlik.on('error', (error) => console.error(error));const app = qlik.openApp('<APP_ID>', config);app.visualization.create('gauge',[{"qDef": {"qLabel": "Fairway hits","qDef": "Avg(FwHit)","qNumFormat": {"qType": "F","qnDec": 2,"qUseThou": 0,"qFmt": "0.0%","qDec": ".","qThou": ","}}}],{"showTitles": false,"measureAxis": {"min": 0,"max": 1},"gaugetype": "bar","autoOrientation": false,"orientation": "vertical","useSegments": true,"segmentInfo": {"limits": [{"value": 0.25,"gradient": true},{"value": 0.5,"gradient": true}],"paletteColors": [{"color": "#ff7373","index": -1},{"color": "#fab761","index": -1},{"color": "#91c26a","index": -1}]}}).then((vis)=>{vis.show("QV01");});});