Build a simple mashup using nebula.js
Where possible, use qlik-embed rather than this framework.
For more information, review the embedding Qlik Analytics using qlik-embed web components tutorial.
This tutorial leverages cookies for auth, which are blocked by some browser vendors. Please use an OAuth solution where possible, which doesn’t leverage cookies.
This guide walks you through creating a simple mashup that connects to Qlik Cloud and visualizes some data.
It includes the following steps:
- Set up a Qlik Cloud Analytics tenant.
- Create a simple web project.
- Configure connection.
- Visualize data.
This guide requires that you have:
node.jsv10.0.0+installed on your machine- A decent IDE, VS Code is recommended.
Set up a Qlik Cloud Analytics tenant
Although nebula.js works and can be integrated with all Qlik Sense products,
this guide shows you how to integrate with Qlik Cloud Analytics.
Perform the following steps:
- Register for a subscription on Qlik Cloud Analytics.
- Configure your deployment.
- Create a new web integration
from the Management console.
- You later run the mashup from your local machine; to allow this
connection to happen, you should add
http://localhost:1234to the whitelist of origins. - Once the web integration has been created, an ID is assigned to it;
this is the
qlik-web-integration-idyou need later on.
- You later run the mashup from your local machine; to allow this
connection to happen, you should add
- Upload an app
- If you don’t have an app or data already prepared, you can download the movies dataset from the GitHub repository and upload it to the cloud.
Each Qlik Sense app on Qlik Cloud has a global unique identifier (GUID), which you need
later on. The GUID can be extracted from the URL and is the part that
follows /app. For example, if the URL is https://your-tenant.us.qlikcloud.com/sense/app/7fc4d85c-0e07-4160-90a9-c2ca4a45fd81
, then the GUID of the app is 7fc4d85c-0e07-4160-90a9-c2ca4a45fd81.
Create a simple web project
The quickest way to create a web project is to use the nebula.js command line
interface:
npx @nebula.js/cli create mashup hello-saasThe command scaffolds a web project into the hello-saas folder with the
following structure:
/srcconfigure.js- Initial configuration ofnebula.jsconnect.js- Connection setup withenigma.jsindex.html- A minimal HTML pageindex.js- Connect and visualize
/src/index.js is where you need to make modifications later on to bring
everything together.
Configure connection
To configure the connection, you need the following:
- The Qlik Cloud tenant URL.
- The web integration ID (
qlik-web-integration-id). - The GUID of the app you want to open.
Open up src/index.js and update the <> placeholders with the correct values,
for example:
const app = await connect({ url: "https://your-tenant.us.qlikcloud.com", webIntegrationId: "8Ys9sBVyq6i2lxtclPWaaZhQr7OgwKaT", appId: "7fc4d85c-0e07-4160-90a9-c2ca4a45fd81",});Visualize data
The movies dataset you uploaded earlier has a bar chart on the first sheet with
the ID EAjjuyE. You can render that same bar chart in your mashup by providing
the ID and an element to render the visualization into:
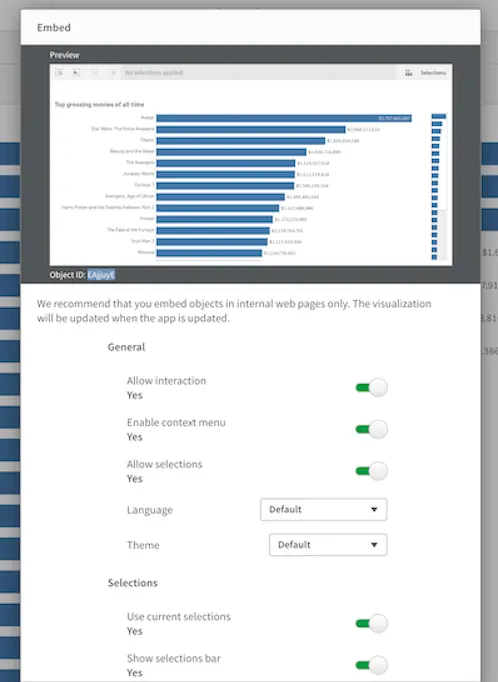
n.render({ element: document.querySelector(".object"), id: "EAjjuyE",});To get the object Id of a chart you do the following:
- Right click the chart object itself or open context menu to select “share“.
- Then select “Embed”
- Find and copy the object Id
Start the web development server by executing the following in a terminal:
npm run startThe server runs on http://localhost:1234.
When opening the page, you may be re-routed to your tenant to sign in if the session timed out since you did the setup. Once signed in, you are re-routed back to the development server where you should see the same bar chart:
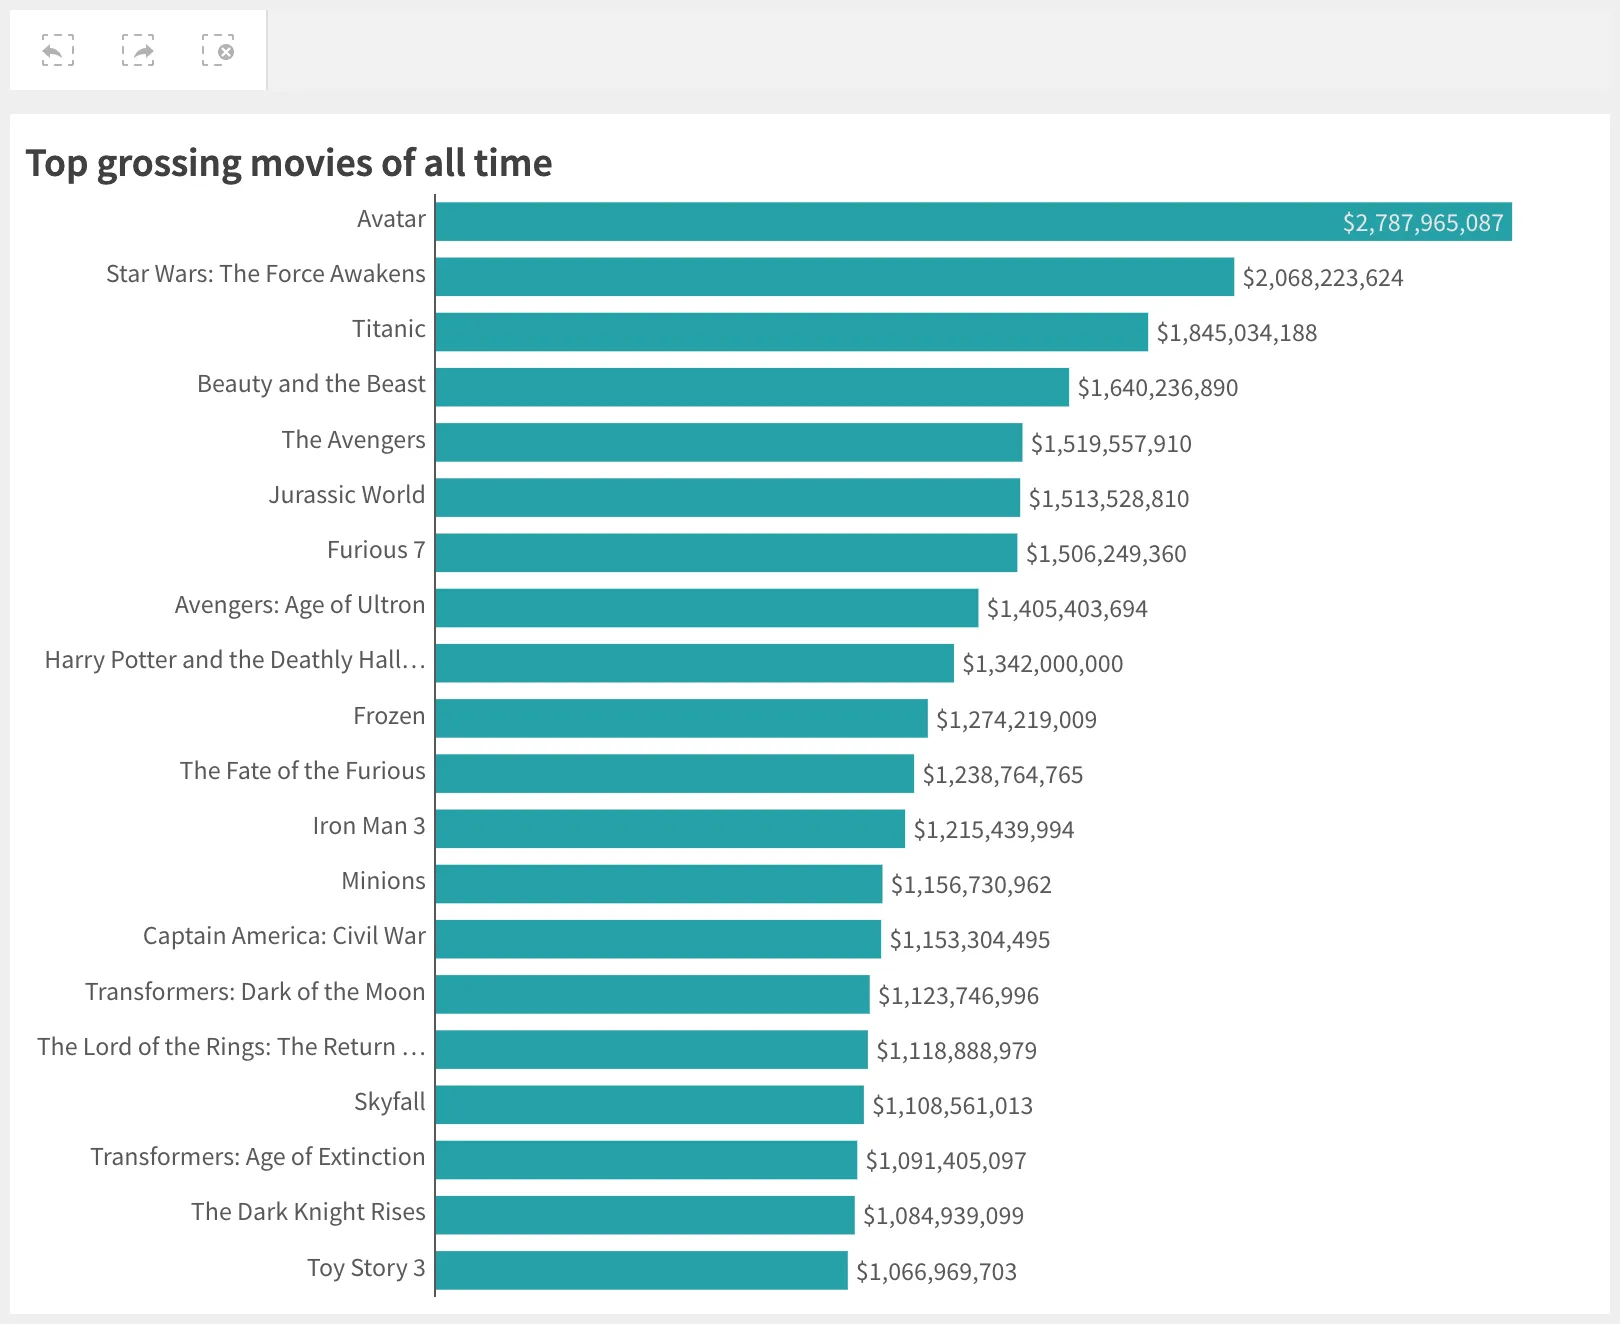
The visualization is fully interactive, any selections you make are reflected in the current app selections toolbar at the top.
More visualizations
Render on the fly
You can render a visualization without having to create it in the app by
providing the type and some data fields:
n.render({ element: document.querySelector(".object"), type: "barchart", fields: ["title", "=avg(rating)"],});More types
The core stardust module doesn’t contain any visualizations. Each
visualization is its own separate module and needs to be loaded and registered
before it can be used.
Official visualizations from Qlik are published under the @nebula.js scope
and are prefixed with sn-.
For a list of available visualizations, see Supported charts.
The template you created your mashup from only includes the bar-chart module.
You can add more types by installing each one you want to use:
npm install @nebula.js/sn-pie-chartThen modify /src/configure.js to include the new modules:
import piechart from '@nebula.js/sn-pie-chart';//...
embed.createConfiguration({  // ...  types: [    // ...    {      name: 'piechart',      load: () => Promise.resolve(piechart)    }  ];}
Without node and a bundler
While it is recommended to use a bundler like Webpack, Rollup, or Parcel
to get the most out of your mashup development, it is still possible to
use Nebula with regular <script> tag imports on any web page.
<script src="https://cdn.jsdelivr.net/npm/@nebula.js/stardust"></script><script src="https://cdn.jsdelivr.net/npm/@nebula.js/sn-bar-chart"></script><script src="https://cdn.jsdelivr.net/npm/enigma.js"></script>By importing the packages this way, they will be available on the global window object like this:
const embed = window.stardust.embed;const barchart = window[`sn-bar-chart`];const enigma = window.enigma;They can then be used as normal.