Build a web app for the Insight Advisor API
The tutorial Explore app content using the Insight Advisor APIs laid the groundwork for gaining analytic insights through the Insight Advisor API using Postman. This tutorial builds on your knowledge by showing you how to call the same API endpoints using a web app. It is recommended that you review the first tutorial before proceeding with this one. It would also be helpful to have a basic understanding of JavaScript programming and package managers.
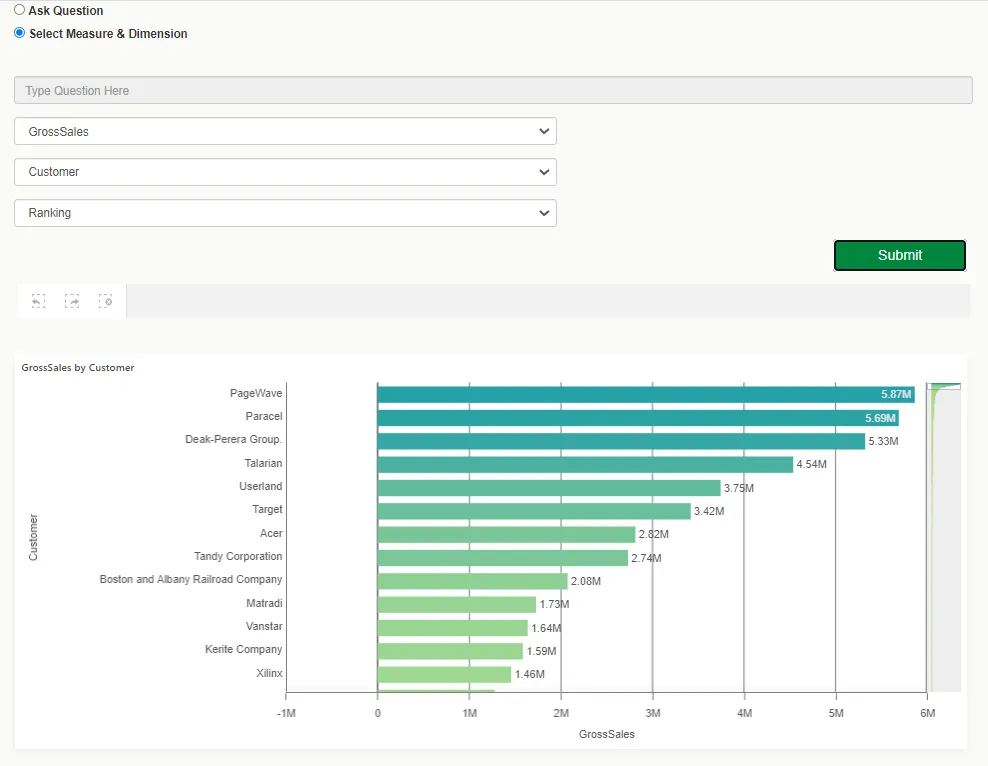
In this tutorial, you will create a UI in a browser that allows you to pose natural language questions, or select dimensions and measures in conjunction with a specific analysis type. The result is an interactive chart based on your input. Here’s a preview of what the UI will look like.
This tutorial uses the following Insight Advisor API endpoints:
api/v1/apps/{appId}/insight-analysesapi/v1/apps/{appId}/insight-analyses/modelapi/v1/apps/{appId}/insight-analyses/actions/recommend
Prerequisites
- Access to a Qlik Cloud tenant.
- “Demo App - Beginner’s tutorial” Qlik Sense application from the Beginning with the Basics tutorial on Qlik Help.
- Web integration ID configured to whitelist
http://localhost:1234, unless you customize the code in the tutorial to use a different port or hostname. For more information, see Managing web integrations on Qlik Help. - Visual Studio Code or similar code editor.
- Yarn package manager. (Yarn can be installed using node.js)
Supported charts
See charts for a list of chart types supported by Insight Advisor.
Quick start
If you want to dive right into the code, you can download the tutorial source code as a ZIP file from Qlik Help.
1 Start the project
The first step is to create a root folder for the project called
insight-advisor-api-tutorial. This folder will act as a container for your files.
2 Create an environment file
The idea here is to create a file that allows you to store environment variables in one place and isolate them from your app. This helps to keep the project organized.
-
In the root folder, create a file named
.envto hold your tenant configuration details. -
Add the following code to the file:
PROJECT_NAME="Insight Advisor APIs"TENANT_URL="https://<TENANT_URL>"APP_ID="<APP_ID>"WEB_INTEGRATION_ID="<WEB_INT_ID>"Substitute the variables with the appropriate URL and IDs.
3 Create the package.json file
In the root folder, create a file named package.json. This file will hold the
metadata relevant to the project such as the project’s dependencies and scripts.
Add the following code to your package.json file:
{ "name": "insight-advisor-tutorial", "version": "0.0.1", "keywords": [ "qlik", "nebula" ], "scripts": { "start": "parcel src/index.html --open --no-hmr", "build": "parcel build src/index.html --dist-dir ./dist" }, "dependencies": { "@nebula.js/sn-bar-chart": "^1.x", "@nebula.js/sn-line-chart": "^1.21.11", "@nebula.js/sn-scatter-plot": "^3.42.0", "@nebula.js/stardust": "3.0.4", "dotenv": "^16.0.3", "enigma.js": "^2.6.3", "node-fetch": "2", "parcel": "^2.8.3", "prettier": "^2.8.3" }, "devDependencies": { "@babel/core": "^7.20.12", "buffer": "^5.7.1", "os-browserify": "^0.3.0", "path-browserify": "^1.0.1", "process": "^0.11.10" }}4 Install the dependencies
In a terminal window, run the following commands from the root folder:
yarn install
yarn add @nebula.js/stardust
All the dependencies that are required by the app such as nebula.js, enigma.js, and other libraries and modules are installed in your project.
5 Define the user interface for the web app
Create a folder for your scripts, CSS, and HTML files within the root folder and
name it src.
In the src folder, create an index.html file. This file will define all
the user interface (UI) elements that you need to display the app in your
browser. Add the following code to the file:
<!DOCTYPE html><html lang="en">
<head>  <title>Insight Advisor APIs Demo</title>  <meta charset="UTF-8" />  <script src="https://ajax.googleapis.com/ajax/libs/jquery/2.1.3/jquery.min.js"></script>  <link rel="stylesheet" href="https://maxcdn.bootstrapcdn.com/bootstrap/3.4.1/css/bootstrap.min.css">  <script src="https://maxcdn.bootstrapcdn.com/bootstrap/3.4.1/js/bootstrap.min.js"></script>  <script src="//code.jquery.com/jquery-1.11.1.min.js"></script>  <link rel="stylesheet" href="./style.css" /></head>
<body style="background-color: rgb(251, 251, 249);">  <div style="margin-left: 5%;">    <div class="form-check">      <input class="form-check-input" type="radio" name="flexRadioDefault" id="askQuestion"        onchange="disableMetadataSelections()" checked>      <label class="form-check-label" for="askQuestion">        Ask Question      </label>    </div>    <div class="form-check">      <input class="form-check-input" type="radio" name="flexRadioDefault" id="selectMetadata"        onchange="disableQuestionBox()">      <label class="form-check-label" for="selectMetadata">        Select Measure & Dimension      </label>    </div>  </div>  <form action="#" id="formId">    <div style="margin-left: 5%;">      <div class="form-group">        <input type="text" class="form-control" id="inputText" placeholder="Type Question Here"          style="width: 53% !important; margin-top: 35px;">      </div>      <div class="form-group">        <select class="form-control md-3" id="selectMeasure" style="width: 30% !important" disabled>          <optgroup label="Fields" id="fieldMeasures">            <option>Select Measure</option>          </optgroup>          <optgroup label="Master Items" id="masterMeasures">          </optgroup>        </select>      </div>      <div class="form-group">        <select class="form-control md-3" id="selectDimension" style="width: 30% !important" disabled>          <optgroup label="Fields" id="fieldDimensions">            <option>Select Dimension</option>          </optgroup>          <optgroup label="Master Items" id="masterDimensions">          </optgroup>        </select>      </div>      <div class="form-group">        <select class="form-control md-3" id="selectAnalysis" style="width: 30% !important" disabled>          <option value="rank-rank">Select Analysis</option>        </select>      </div>    </div>    <div class="form-group">      <button type="submit" class="btn btn-success" id="btnSubmit"        style="margin-left: 48%; width: 7%; font-size: 17px; background-color: #00873d;">Submit</button>    </div>  </form>  <div id="app">    <div id="selection" class="curr-selections" style="width: 50% !important; margin-left: 5.2% !important;"></div>    <div id="chart" style="width: 50% !important; margin-left: 4.5%"></div>  </div>  <script type="module" src="./index.js"></script>  <script>    function disableMetadataSelections() {      document.getElementById("inputText").value = '';      document.getElementById("selectMeasure").disabled = true;      document.getElementById("selectDimension").disabled = true;      document.getElementById("selectAnalysis").disabled = true;      document.getElementById("inputText").disabled = false;    }    function disableQuestionBox() {      document.getElementById("inputText").value = '';      document.getElementById("inputText").disabled = true;      document.getElementById("selectMeasure").disabled = false;      document.getElementById("selectDimension").disabled = false;      document.getElementById("selectAnalysis").disabled = false;    }  </script></body>
</html>
Now, create a file named style.css in the /src folder. This file
will control the presentation and positioning of the interactive chart in your
browser. Add the following code to the file:
#chart {    background: #fff;    border-radius: 2px;    box-shadow: 0 4px 12px rgba(0, 0, 0, 0.05);}
#chart {    position: absolute;    top: 38%;    left: 12px;    height: 476px;    right: 20%;}
6 Open a connection to Qlik Cloud Analytics
The next step is to use the API to communicate with Qlik Cloud Analytics. The
app needs to open a session with Qlik Cloud Analytics so that charts can be
rendered. To do that, create a /src/cloud.engine.js file.
Add the following code to the cloud.engine.js file.
import enigma from "enigma.js";const schema = require("enigma.js/schemas/12.1306.0.json");
export default class EngineService {  constructor(engineUri) {    this.engineUri = engineUri;  }
  /**   * @param {*} headers contains csrf-token and web-integration-id   */  openEngineSession(headers) {    const params = Object.keys(headers)      .map((key) => `${key}=${headers[key]}`)      .join("&");    const session = enigma.create({      schema,      url: `${this.engineUri}?${params}`,    });    session.on("traffic:sent", (data) => console.log("sent:", data));    session.on("traffic:received", (data) => console.log("received:", data));    return session;  }
  /**   * @param {*} session session created in getHyperCubeData method   * closes the session   */  async closeEngineSession(session) {    if (session) {      await session.close();      console.log("session closed");    }  }
  async getOpenDoc(appId, headers) {    let session = this.openEngineSession(headers);    let global = await session.open();    // get a doc for specific appId    let doc = await global.openDoc(appId);    return doc;  }}
The EngineService class uses the enigma library to open a session with the
engine. While the session is open, the Qlik Cloud Analytics app can be
accessed through the doc object, which is inputted to the nebula.js
library. Selections made in the chart can then be sent back to Qlik Cloud
Analytics for filtering.
7 Create the main script
The main script does all the heavy lifting such as handling all the interaction
with the UI and filling it with selectable fields, and making requests to the
Insight Advisor API endpoints. The main script also instantiates the
EngineService class (cloud.engine.js), which establishes a session with
Qlik Cloud Analytics.
The descriptions presented in this section are meant to highlight the key
aspects of the script and are not intended to be comprehensive. To fully
understand what makes the script work will require a more in-depth review of
the code. You can find the complete code for the main script (index.js) by
downloading the project files using the link provided in the
Quick start section.
Import the dependencies and set up the headers
First, you need to get the dependencies such as nebula chart objects and assign
them to variables so that they’re accessible in the code. Similarly, you need
to collect the tenant configuration stored in the .env file. Headers must also
be defined, including the web integration ID, which allows the web app to access
the tenant from a third-party domain.
import fetch from 'node-fetch';import barchart from '@nebula.js/sn-bar-chart';import line from '@nebula.js/sn-line-chart';import scatterplot from '@nebula.js/sn-scatter-plot';import EngineService from './cloud.engine.js';import { embed } from '@nebula.js/stardust';require('dotenv').config({ path: '../.env' });
const charts = { barchart, linechart: line, scatterplot };const tenantUrl = process.env.TENANT_URL;const appId = process.env.APP_ID;const webIntegrationId = process.env.WEB_INTEGRATION_ID;const headers = {  'accept-language': 'en',  'Content-Type': 'application/json',  'qlik-web-integration-id': webIntegrationId,
Populate the dropdown lists
Make function calls to the Insight Advisor API to retrieve the dimensions, measures, master items, and analysis types so that they can be displayed in the UI in the browser.
async function fetchMedata() {  // retrieve the analyses types for given application  const analysesResponse = await getAnalyses();  // retrieve the classification information such as fields and master items  // along with it's classifications  const metadata = await getClassifications();
  // fill up the analyses dropdown  analysesResponse.data.forEach((analysis) => {    const name = analysis.compositions[0].description.short;    const value = analysis.id;    analyses.append(`<option value="${value}">${name}</option>`);  });
  // filter out dimension from fields  const fieldDimensions = metadata.data.fields.filter((field) => field.simplifiedClassifications.includes('dimension'));  fieldDimensions.forEach((dimension) => {    const name = dimension.name;    fieldDimensionsRef.append(`<option value="${name}">${name}</option>`);  });
  // filter out dimension from master items  const masterDimensions = metadata.data.masterItems.filter((masterItem) =>    masterItem?.classifications.includes('dimension')  );  masterDimensions.forEach((dimension) => {    const name = dimension.caption;    const value = dimension.libId;    masterDimensionsRef.append(`<option value="${value}">${name}</option>`);  });
  // filter out measures from fields  const fieldMeasures = metadata.data.fields.filter((field) => field.simplifiedClassifications.includes('measure'));  // fill up the measures dropdown  fieldMeasures.forEach((measure) => {    const name = measure.name;    fieldMeasuresRef.append(`<option value="${name}">${name}</option>`);  });  // filter out measures from master items  const masterMeasures = metadata.data.masterItems.filter((masterItem) =>    masterItem?.classifications.includes('measure')  );  // fill up the measures dropdown  masterMeasures.forEach((measure) => {    const name = measure.caption;    const value = measure.libId;    masterMeasuresRef.append(`<option value="${value}">${name}</option>`);  });}
Get the recommendations and render the chart
In this step, you’ll call the getRecommendation() function to get the
recommendations in response to the natural language question or
the metadata (dimensions and measures) that you selected in the UI. Once you
get the recommendations object from the API, you create the engineService
object to access the Qlik Cloud Analytics app. The response is an app object
that you pass with the recommendation object to the renderHypercubeDef function
to render the chart.
async function fetchRecommendationAndRenderChart(requestPayload) {  console.log(requestPayload);  // fetch recommendations for text or metadata  const recommendations = await getRecommendation(requestPayload);  console.log('recommendations received');
  const engineUrl = `${tenantUrl.replace('https', 'wss')}/app/${appId}`;  // fetch rec options which has hypercubeDef  const recommendation = recommendations.data.recAnalyses[0];  // get csrf token  const qcsHeaders = await getQCSHeaders();  const engineService = new EngineService(engineUrl);  // get openDoc handle  const app = await engineService.getOpenDoc(appId, qcsHeaders);  await renderHypercubeDef(app, recommendation);}
async function renderHypercubeDef(app, recommendation) {  const type = recommendation.chartType;
  const nebbie = embed(app, {    types: [      {        name: type,        load: async () => charts[type],      },    ],  });
  document.querySelector('.curr-selections').innerHTML = '';  (await nebbie.selections()).mount(document.querySelector('.curr-selections'));
  await nebbie.render({    type: type,    element: document.getElementById('chart'),    extendProperties: true,    properties: { ...recommendation.options },    // fields: ["Month", "=sum(Sales)"],  });}
Retrieve the possible analysis types
Make an API request to get a list of all possible analysis types
that can be used in new analyses given the data model of your Qlik Cloud app.
Define function getAnalyses() to call the api/v1/apps/{appId}/insight-analyses
endpoint with the GET method.
async function getAnalyses() { await qlikLogin(); // make sure you are logged in to your tenant // build url to execute analyses call const endpointUrl = `${tenantUrl}/api/v1/apps/${appId}/insight-analyses`; const response = await fetch(endpointUrl, { credentials: "include", mode: "cors", method: 'GET', headers, }); const analysesResponse = await response.json(); return analysesResponse;}Retrieve the app logical model, fields, and master items
Make a request to get a list of each field and master item
in your app’s logical model, classifying it as a dimension, measure, or other.
Define function getClassifications() to call the api/v1/apps/{appId}/insight-analyses/model
endpoint with the GET method.
async function getClassifications() { await qlikLogin(); // make sure you are logged in to your tenant // build url to execute classification call const endpointUrl = `${tenantUrl}/api/v1/apps/${appId}/insight-analyses/model`; const response = await fetch(endpointUrl, { credentials: "include", mode: "cors", method: 'GET', headers, }); const classificationResponse = await response.json(); return classificationResponse;}Specify a natural language question, or fields and a target analysis type
Through the UI, you can pose a question, or select dimensions, measures, and an
analysis type. Define a function to call the
api/v1/apps/{appId}/insight-analyses/actions/recommend endpoint with the POST
method and determine if the UI selection is either a question or dimensions and
measures.
async function getRecommendation(requestPayload) {  await qlikLogin(); // make sure you are logged in to your tenant  const qcsHeaders = await getQCSHeaders();  headers["qlik-csrf-token"] = qcsHeaders["qlik-csrf-token"];  // build url to execute recommendation call  const endpointUrl = `${tenantUrl}/api/v1/apps/${appId}/insight-analyses/actions/recommend`;  let data = {};  // generate request payload  if (requestPayload.text) {    data = JSON.stringify({      text: requestPayload.text,    });  } else if (requestPayload.fields || requestPayload.libItems) {    data = JSON.stringify({      fields: requestPayload.fields,      libItems: requestPayload.libItems,      targetAnalysis: { id: requestPayload.id },    });  }  const response = await fetch(endpointUrl, {    credentials: "include",    mode: "cors",    method: 'POST',    headers,    body: data,  });
  const recommendationResponse = await response.json();  return recommendationResponse;}
Get the CSRF token
In this step, you’ll get the Cross-Site Request Forgery (CSRF) token, which is required as a header in all non-GET requests.
async function getQCSHeaders() {  await qlikLogin(); // enforce tenant login  const response = await fetch(`${tenantUrl}/api/v1/csrf-token`, {    mode: 'cors',    credentials: 'include',    headers: {      'qlik-web-integration-id': webIntegrationId,    },  });
  const csrfToken = new Map(response.headers).get('qlik-csrf-token');  return {    'qlik-web-integration-id': webIntegrationId,    'qlik-csrf-token': csrfToken,  };}
Check if the user is signed in
You must be signed in to the tenant before you can access its resources. In this
step, you’ll fetch the user metadata, and trigger the single sign-on flow if
the user isn’t signed on to the Qlik Cloud tenant. The single sign-on flow redirects
the user to the login screen.
async function qlikLogin() { const loggedIn = await fetch(`${tenantUrl}/api/v1/users/me`, { mode: 'cors', credentials: 'include', headers: { 'qlik-web-integration-id': webIntegrationId, }, }); if (loggedIn.status !== 200) { if (sessionStorage.getItem('tryQlikAuth') === null) { sessionStorage.setItem('tryQlikAuth', 1); window.location = `${tenantUrl}/login?qlik-web-integration-id=${webIntegrationId}&returnto=${location.href}`; return await new Promise((resolve) => setTimeout(resolve, 10000)); // prevents further code execution } else { sessionStorage.removeItem('tryQlikAuth'); const message = 'Third-party cookies are not enabled in your browser settings and/or browser mode.'; alert(message); throw new Error(message); } } sessionStorage.removeItem('tryQlikAuth'); console.log('Logged in!'); return true;}Download the main script
You have reviewed the code in the main script file but you have not added it to
your project yet. Download the source for the main script
(src/index.js) from Qlik Help and add it to the src folder in your project.
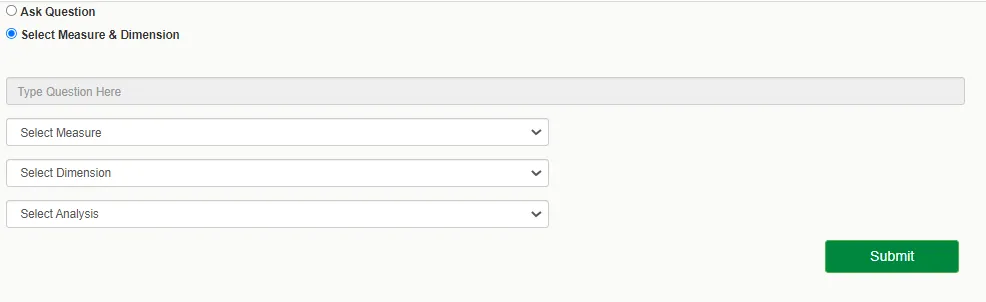
8 Run the web app
Now that you have all the code in place, it’s time to run the web app. In a terminal window, run the following command from the root folder:
yarn run start
The command starts a local web server and opens the browser. The following UI should appear:
-
Select Select Measure & Dimension.
-
In the Select Measure list, select GrossSales.
-
In the Select Dimension list, select Customer.
-
In the Select Analysis list, select Ranking.
-
Click Submit.
The response includes recommendations for chart type sorted according to the highest relevance. In this case, Insight Advisor chooses a bar chart to be displayed.