Creating waterfall charts
Where possible, use qlik-embed and qlik/api rather than this framework.
This section describes how to create waterfall charts with the Visualization API.
Creating a basic waterfall chart
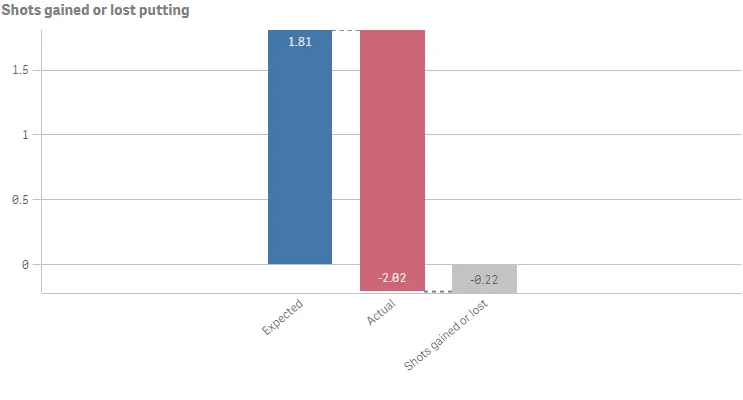
In this example, you will create a basic waterfall chart containing three measures, with a custom title and color legend switched off.
-
Create the chart.
Create the container for the chart. The visualization type is
waterfallchart.app.visualization.create('waterfallchart',[],{}) -
Define the first measure.
Define the first measure as a column. The first measure is using the measure operation Add:
"valueType": "NORMAL".[{"qDef": {"qLabel": "Expected","qDef": "Avg(ExpPutts)","valueType": "NORMAL"}}] -
Define the second measure.
Define the second measure as a column. It is using the measure operation Subtract:
"valueType": "INVERSE".[{"qDef": {"qLabel": "Expected","qDef": "Avg(ExpPutts)","valueType": "NORMAL"}},{"qDef": {"qLabel": "Actual","qDef": "Avg(Putts)","valueType": "INVERSE"}}] -
Define the third measure.
Define the third measure as a column. The first measure is using the measure operation Subtotals:
"valueType": "SUBTOTAL".[{"qDef": {"qLabel": "Expected","qDef": "Avg(ExpPutts)","valueType": "NORMAL"}},{"qDef": {"qLabel": "Actual","qDef": "Avg(Putts)","valueType": "INVERSE"}},{"qDef": {"qLabel": "Shots gained or lost","qDef": "Avg(ExpPutts-Putts)","valueType": "SUBTOTAL"}}] -
Define the title.
Then add a custom title and switch off the legend in the options.
{"showTitles": true,"title": "Shots gained or lost putting","legend": {"show": false}}
Result
Complete code example: Waterfall chart
-
Visualization API
const config = {host: '<TENANT_URL>', //for example, 'abc.us.example.com'prefix: '/',port: 443,isSecure: true,webIntegrationId: '<WEB_INTEGRATION_ID>'};require.config({baseUrl: `https://${config.host}/resources`,webIntegrationId: config.webIntegrationId});require(["js/qlik"], (qlik) => {qlik.on('error', (error) => console.error(error));const app = qlik.openApp('<APP_ID>', config);app.visualization.create('waterfallchart',[{"qDef": {"qLabel": "Expected","qDef": "Avg(ExpPutts)","valueType": "NORMAL"}},{"qDef": {"qLabel": "Actual","qDef": "Avg(Putts)","valueType": "INVERSE"}},{"qDef": {"qLabel": "Shots gained or lost","qDef": "Avg(ExpPutts-Putts)","valueType": "SUBTOTAL"}}],{"showTitles": true,"title": "Shots gained or lost putting","legend": {"show": false}}).then((vis)=>{vis.show("QV01");});});
Defining number formatting and grid line spacing
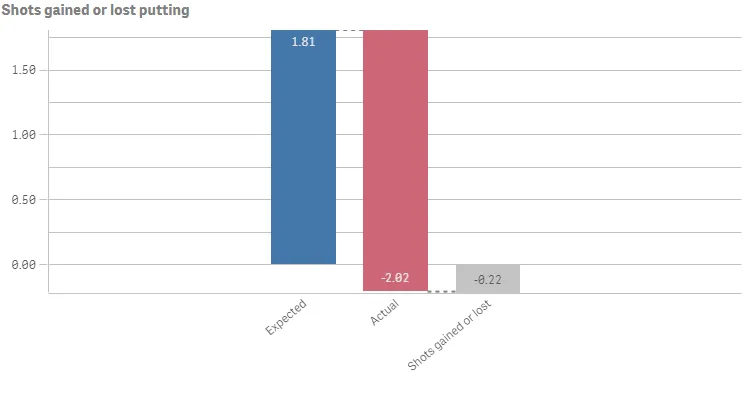
In this example, the number formatting is changed to always display two decimals and the grid line spacing has been set to narrow.
-
Set the number formatting.
Change the number formatting for all three measures in the columns:
"qNumFormat": {"qType": "F","qnDec": 2,"qUseThou": 0,"qFmt": "#,##0.00","qDec": ".","qThou": ","} -
Set the grid line spacing.
Then specify the grid line spacing in the options:
"gridlines": { "auto":false, "spacing": 3 }, where 3 means narrow.{"showTitles": true,"title": "Shots gained or lost putting","gridlines": {"auto": false,"spacing": 3},"legend": {"show": false}}
Result
Example waterfall chart with modified number formats and grid spacing
Complete code example: Waterfall chart with modified number formats and grid spacing
-
Visualization API
const config = {host: '<TENANT_URL>', //for example, 'abc.us.example.com'prefix: '/',port: 443,isSecure: true,webIntegrationId: '<WEB_INTEGRATION_ID>'};require.config({baseUrl: `https://${config.host}/resources`,webIntegrationId: config.webIntegrationId});require(["js/qlik"], (qlik) => {qlik.on('error', (error) => console.error(error));const app = qlik.openApp('<APP_ID>', config);app.visualization.create('waterfallchart',[{"qDef": {"qLabel": "Expected","qDef": "Avg(ExpPutts)","valueType": "NORMAL","qNumFormat": {"qType": "F","qnDec": 2,"qUseThou": 0,"qFmt": "#,##0.00","qDec": ".","qThou": ","}}},{"qDef": {"qLabel": "Actual","qDef": "Avg(Putts)","valueType": "INVERSE","qNumFormat": {"qType": "F","qnDec": 2,"qUseThou": 0,"qFmt": "#,##0.00","qDec": ".","qThou": ","}}},{"qDef": {"qLabel": "Shots gained or lost","qDef": "Avg(ExpPutts-Putts)","valueType": "SUBTOTAL","qNumFormat": {"qType": "F","qnDec": 2,"qUseThou": 0,"qFmt": "#,##0.00","qDec": ".","qThou": ","}}}],{"showTitles": true,"title": "Shots gained or lost putting","gridlines": {"auto": false,"spacing": 3},"legend": {"show": false,"dock": "auto"}}).then((vis)=>{vis.show("QV01");});});
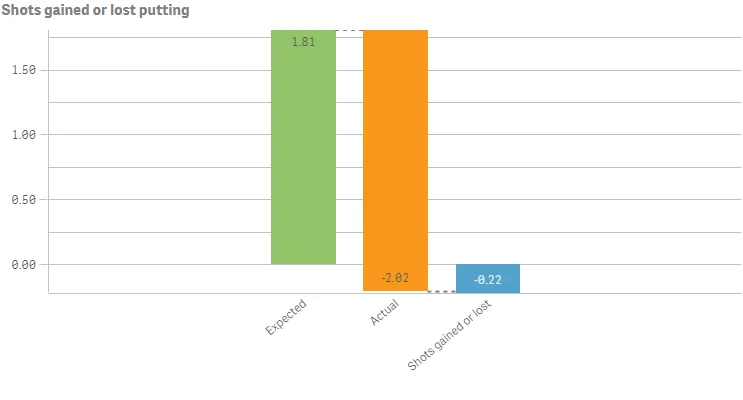
Using custom colors
You can set the presentation color for the different measure operations: Positive value color, Negative value color, and Subtotal color.
The following colors are being used in this example:
- Positive value color:
#91c26a - Negative value color:
#f8981d - Subtotal color:
#52a2cc
-
Define the colors.
The colors are defined in the color object. Switch off auto coloring:
"auto": false. Then add a definition for the positive value color:"positiveValue": { "paletteColor": { "index": -1, "color": "#91c26a" }. Add the definition for the negative value color:"negativeValue":{ "paletteColor": { "index": 9, "color": "#f8981d" } }. Finally, define the subtotal color:"subtotal": { "paletteColor": { "index": -1, "color":"#52a2cc" } }."color": {"auto": false,"positiveValue": {"paletteColor": {"index": -1,"color": "#91c26a"}},"negativeValue": {"paletteColor": {"index": 9,"color": "#f8981d"}},"subtotal": {"paletteColor": {"index": -1,"color": "#52a2cc"}}}
Result
Complete code example: Waterfall chart with custom color modification
-
Visualization API
const config = {host: '<TENANT_URL>', //for example, 'abc.us.example.com'prefix: '/',port: 443,isSecure: true,webIntegrationId: '<WEB_INTEGRATION_ID>'};require.config({baseUrl: `https://${config.host}/resources`,webIntegrationId: config.webIntegrationId});require(["js/qlik"], (qlik) => {qlik.on('error', (error) => console.error(error));const app = qlik.openApp('<APP_ID>', config);app.visualization.create('waterfallchart',[{"qDef": {"qLabel": "Expected","qDef": "Avg(ExpPutts)","valueType": "NORMAL","qNumFormat": {"qType": "F","qnDec": 2,"qUseThou": 0,"qFmt": "#,##0.00","qDec": ".","qThou": ","}}},{"qDef": {"qLabel": "Actual","qDef": "Avg(Putts)","valueType": "INVERSE","qNumFormat": {"qType": "F","qnDec": 2,"qUseThou": 0,"qFmt": "#,##0.00","qDec": ".","qThou": ","}}},{"qDef": {"qLabel": "Shots gained or lost","qDef": "Avg(ExpPutts-Putts)","valueType": "SUBTOTAL","qNumFormat": {"qType": "F","qnDec": 2,"qUseThou": 0,"qFmt": "#,##0.00","qDec": ".","qThou": ","}}}],{"showTitles": true,"title": "Shots gained or lost putting","gridlines": {"auto": false,"spacing": 3},"color": {"auto": false,"positiveValue": {"paletteColor": {"index": -1,"color": "#91c26a"}},"negativeValue": {"paletteColor": {"index": 9,"color": "#f8981d"}},"subtotal": {"paletteColor": {"index": -1,"color": "#52a2cc"}}},"legend": {"show": false,"dock": "auto"}}).then((vis)=>{vis.show("QV01");});});
Dimension and measure axis settings
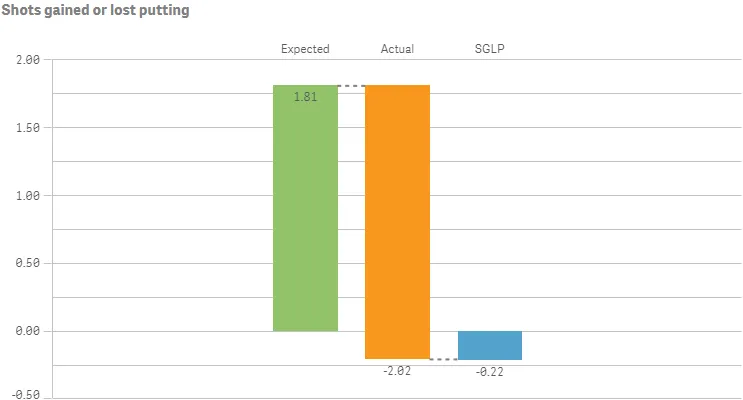
In this example, you will make changes to how the X and Y axes are presented.
-
Configure X axis settings.
X-axis settings are set in the
dimensionAxisobject.Set to display labels only on the X-axis:
"show": "labels". State that the labels should always be horizontally displayed:"label": "horizontal", and positioned at the top of the visualization:"dock": "far"."dimensionAxis": {"show": "labels","label": "horizontal","dock": "far"} -
Configure Y axis settings.
Y-axis settings are set in the
measureAxisobject.For the Y-axis, also set to display labels only:
"show": "labels". Then set narrow scaling of the axis:"spacing": 0.5, where 0.5 means narrow. Disable auto range to define a custom value range for the Y-axis:"autoMinMax":false. Then set the range mode:"minMax": "minMax", and define the minimum and maximum values:"min": -0.5, "max": 2."measureAxis": {"show": "labels","spacing": 0.5,"autoMinMax": false,"minMax": "minMax","min": -0.5,"max": 2}
Result
Note that the label of the third measure has been changed to SGLP in the following example.
Complete code example: Waterfall chart with custom dimension and axis settings
-
Visualization API
const config = {host: '<TENANT_URL>', //for example, 'abc.us.example.com'prefix: '/',port: 443,isSecure: true,webIntegrationId: '<WEB_INTEGRATION_ID>'};require.config({baseUrl: `https://${config.host}/resources`,webIntegrationId: config.webIntegrationId});require(["js/qlik"], (qlik) => {qlik.on('error', (error) => console.error(error));const app = qlik.openApp('<APP_ID>', config);app.visualization.create('waterfallchart',[{"qDef": {"qLabel": "Expected","qDef": "Avg(ExpPutts)","valueType": "NORMAL","qNumFormat": {"qType": "F","qnDec": 2,"qUseThou": 0,"qFmt": "#,##0.00","qDec": ".","qThou": ","}}},{"qDef": {"qLabel": "Actual","qDef": "Avg(Putts)","valueType": "INVERSE","qNumFormat": {"qType": "F","qnDec": 2,"qUseThou": 0,"qFmt": "#,##0.00","qDec": ".","qThou": ","}}},{"qDef": {"qLabel": "SGLP","qDef": "Avg(ExpPutts-Putts)","valueType": "SUBTOTAL","qNumFormat": {"qType": "F","qnDec": 2,"qUseThou": 0,"qFmt": "#,##0.00","qDec": ".","qThou": ","}}}],{"showTitles": true,"title": "Shots gained or lost putting","gridlines": {"auto": false,"spacing": 3},"color": {"auto": false,"positiveValue": {"paletteColor": {"index": -1,"color": "#91c26a"}},"negativeValue": {"paletteColor": {"index": 9,"color": "#f8981d"}},"subtotal": {"paletteColor": {"index": -1,"color": "#52a2cc"}}},"legend": {"show": false,"dock": "auto"},"measureAxis": {"show": "labels","spacing": 0.5,"autoMinMax": false,"minMax": "minMax","min": -0.5,"max": 2},"dimensionAxis": {"show": "labels","label": "horizontal","dock": "far"}}).then((vis)=>{vis.show("QV01");});});