Rendering
You can embed a visualization in two ways:
- Rendering an existing object
- Rendering a visualization on the fly
Rendering is done using the render() method on the instance returned by the
embed function, which at minimum requires the HTMLElement you want to
render into:
import { embed } from "@nebula.js/stardust";
const n = embed(enigmaApp);n.render({  element,  // rest of the config});
Render an existing objects
If you already have created a generic object in your app and want to render it,
you can do so by providing the object’s id:
n.render({ element, id: "<ObjectID>",});Rendering existing objects created in Sense requires matching types, so that Nebula can correctly use the correct visualization for the correct data. A comprehensive list of type names can be found in Supported Charts.
Render on the fly
When rendering a visualization on the fly you need to specify the type
you want to render:
n.render({ element, type: "barchart",});Some visualizations have minimum requirements on the various properties and/or data they need to render, in which case you might see a blank visualization with text that reads “Incomplete visualization.”
To provide initial data to the visualization, add the data dimensions and
measures into the fields property:
n.render({ element, type: "barchart", fields: ["Region", "=sum(Sales)"],});You can also modify the initial properties:
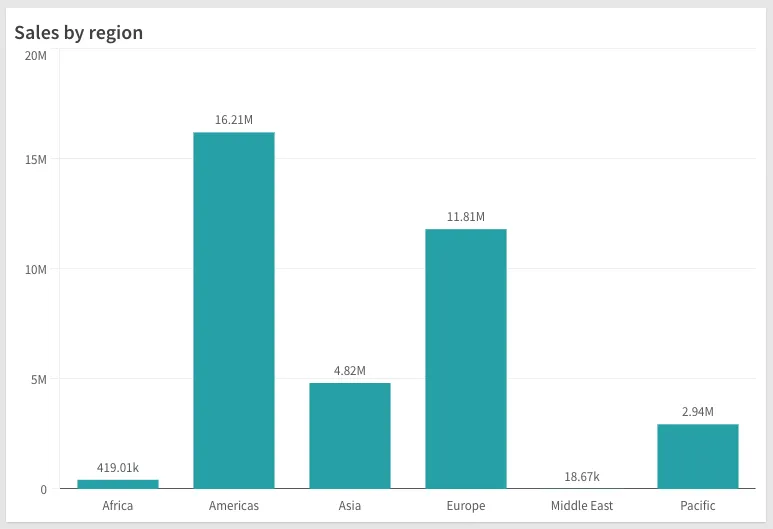
n.render({ element, type: "barchart", fields: ["Product", "=sum(Sales)"], properties: { title: "Sales by region", },});Here is a bar chart with a title that shows the total sales by region: