Get started with the Extension API
Extension API Overview
If you plan to use capability APIs to build custom visualizations, mashups, or extensions, consider using the nebula.js open source library available on NPM instead. nebula.js is a collection of JavaScript libraries, visualizations, and CLIs that helps developers build and integrate visualizations on top of Qlik’s Associative Engine. The Extension API consists of methods and properties used to create custom visualization extensions.
To use the Extension API in visualization extensions, you can follow the simple hello world example created in Create a visualization extension using the Extension-API.
Examples of use
Learn how to use the Extension API in your visualization extensions.
Hello world
define( [],( ) =>{ return { paint: ($element) => { $element.html( "Hello world!!" ); } };} );Initial properties
The initialProperties property specifies the properties the object should have when created.
initialProperties : { qHyperCubeDef : { qDimensions : [], qMeasures : [], qInitialDataFetch : [{ qWidth : 2, qHeight : 50 }] }},Select values
The selectValues method selects values in this object. It activates the
Selection bar and behaves like a standard Qlik Sense selection, including a
selections preview.
If you instead want the selections to be sent to Qlik associative engine right
away, without selection preview and confirmation, you can call the selectValues
method in the Backend API.
$element.find('li').on('click', () => { if(this.hasAttribute("data-value")) { const value = parseInt(this.getAttribute("data-value"), 10), dim = 0; self.selectValues(dim, [value], true); }});Snapshots
The snapshot property enables the ability to take snapshots of visualization extensions for use in data storytelling.
const ext = { support: { snapshot: true }};Exporting and printing
The ability to export visualization extensions to different formats is enabled with the export property. When set to true, the following export capabilities are enabled:
- Export as an image.
- Export to PDF.
- Export story to PowerPoint.
- Export story to PDF.
- In addition, the ability to export data from visualization extensions is enabled with the exportData property.
const ext = { support: { snapshot: true, export: true, exportData: true }};Create a visualization extension using the Extension API
Create the container
Create a folder that will contain your assets. The folder should be created in
the following location:
C:\Users\[UserName]\Documents\Qlik\Sense\Extensions\.
Example:
C:\Users\[UserName]\Documents\Qlik\Sense\Extensions\SimpleHelloWorld
Create the QEXT file
The next step is to create a QEXT file in the folder that you just created and
name it exttut-01-helloworld.qext.
It should contain the following information:
{ "name" : "Simple Hello World 01", "description" : "Extension Tutorial, Simple Hello World.", "icon" : "extension", "type" : "visualization", "version": "0.1", "author": "Qlik"}Create the main script file
Then it is time to create the main script file. Name the file exttut-01-helloworld.js.
This is also placed in the same folder as the QEXT file. Paste the following
code into the script file and then save it:
define( [        'jquery'    ],    ( $ ) => {        'use strict';
        return {
            //Paint resp.Rendering logic            paint: ( $element, layout ) => {
                const $helloWorld = $( document.createElement( 'div' ) );                $helloWorld.html( 'Hello World from the extension                "SimpleHelloWorld"<br/>' );                $element.append( $helloWorld );
            }        };    } );
Test the visualization extension
Now is a good time to test your visualization extension.
Do the following:
-
Open an existing app or create a new one.
-
Open an existing sheet or create a new one.
-
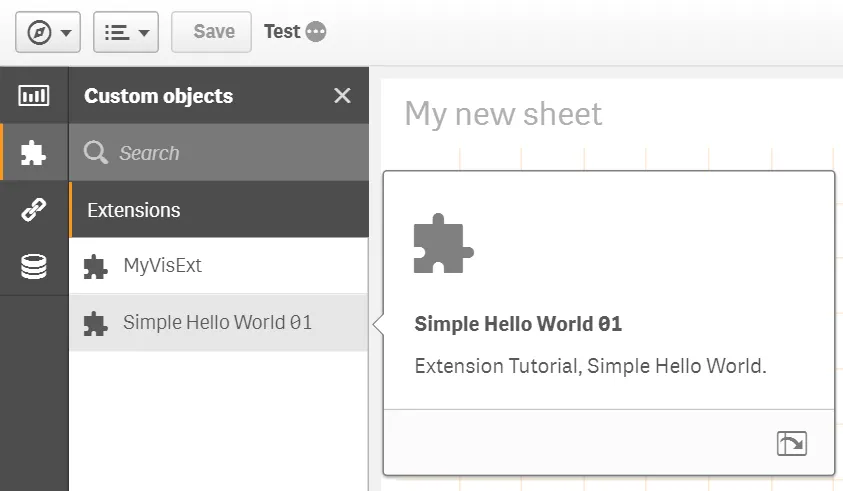
Go to Edit mode. The visualization extension should be visible in the library.

-
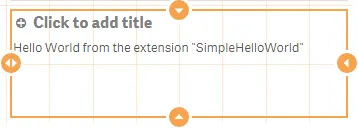
Drag and drop the visualization extension onto the sheet and exit Edit mode. You should see something like the following:

Fine tune the visualization extension
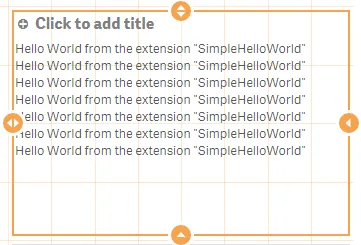
If you resize the visualization extension or the browser window you will realize that some thing is wrong since the output gets multiplied.

This happens because the paint method is called every time the visualization
extension is rendered and therefore resizing the visualization extension
triggers the paint method. This means that a new $helloWorld object is appended
to $element on every resize.
//Paint resp.Rendering logicpaint: ( $element, layout )=> { const $helloWorld = $( document.createElement( 'div' ) ); $helloWorld.html( 'Hello World from the extension "SimpleHelloWorld"<br/>' ); $element.append( $helloWorld );}There are several ways of solving this, two of which are introduced below.
Remove existing content
You can remove all child nodes of $element at the beginning of the paint method, using the jQuery empty() method. Add the following line at the beginning of paint.
$element.empty();Detect if your new node already exists
Use the layout object to get the unique id of the current object to prevent conflicts if you are using the same object several times on a sheet. You can detect if your new node already exists by adding the following code:
const id = layout.qInfo.qId + '_helloworld';const $helloWorld = $( '#' + id );if ( !$helloWorld.length ) { console.log( 'No element found with the given Id, so create the element' ); $helloWorld = $( document.createElement( 'div' ) ); $helloWorld.attr( 'id', id ); $helloWorld.html( 'Hello World' ); $element.append( $helloWorld );} else { console.log( 'Found an element with the given Id, so just change it' ); $helloWorld.html( 'Hello World' );}