Color - Categorical
The categorical-color scale is used to color charts ordinally, that is, with a discrete, ordered set of colors.

Usage
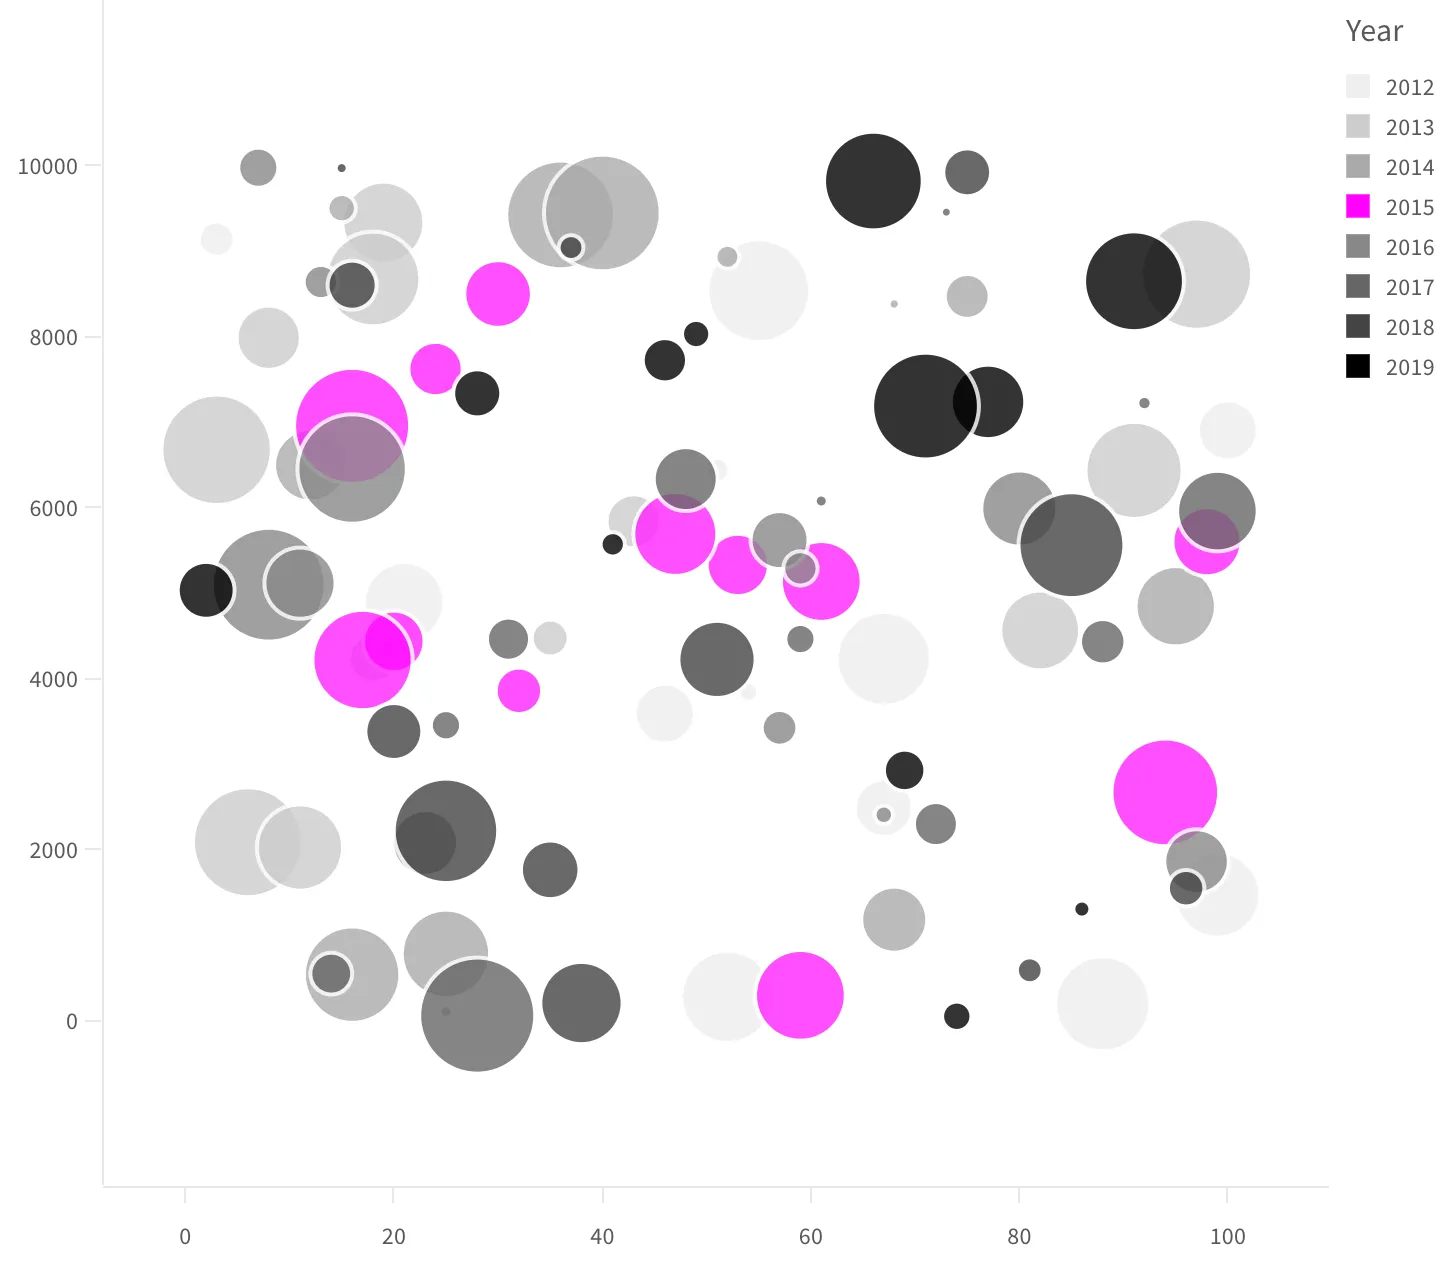
The following example colors the data points from the field Year in colors
ranging from light gray to black. It also explicitly colors the data points
from the year 2015 in the HTML color magenta. The result can be seen in the
previous image.
picasso.chart({ data, element, settings: { scales: { myScale: { data: { extract: { field: "Year" } }, type: "categorical-color", range: [ "#eeeeee", "#cccccc", "#aaaaaa", "#888888", "#666666", "#444444", "#000000", ], explicit: { domain: ["2015"], range: ["magenta"] }, }, }, components: [ { type: "some-component", scale: "myScale", }, ], },});If more categories than colors are supplied, the colors alternate and repeat over the data.
Settings
The property domain can be specified to only color certain data points or to
color them in a different order. The property explicit can be used to
explicitly color certain data points differently from the rest of the chart.
API Reference
For more information, see the API reference.