Band
The Band scales are convenient for charts with an ordinal or categorical dimension.
In this scale, the domain range is represented inside the data property as a 2D array that includes the items from start to end.
Usage
To connect a band scale to the data, you need to specify the scale in the component. The following example creates a band scale (myScale) with the domain defined in the data property. Specifying the type band is required since it is not the default option for a scale.
picasso.chart({ data: { type: "matrix", data: [ ["Month", "Sales"], ["Jan", 3088], ["Feb", 4545], ["Mar", 4542], ["Apr", 6530], ["May", 1785], ["June", 1785], ["July", 9736], ["Aug", 7965], ["Sep", 6710], ["Oct", 4171], ["Nov", 6724], ["Dec", 266], ], }, element, settings: { scales: { myScale: { type: "band", data: ["Jan", "Feb", "Mar"], }, }, components: [ { type: "some-component", scale: "myScale", }, ], },});
Range
Sets the scale’s range to the specified two-element array of numbers.
If range is not specified it uses [0, 1] as a default value.
myBandScale: { type: "band", data: ["Jan", "Feb", "Mar"], range: [0, 0.5],},
Padding
This property sets the inner and outer padding to the same padding
value. It is also possible to specify the paddingInner or paddingOuter value
which is typically in the range [0, 1]
myBandScale: { type: "band", data: ["Jan", "Feb", "Mar"], padding: 0.5,},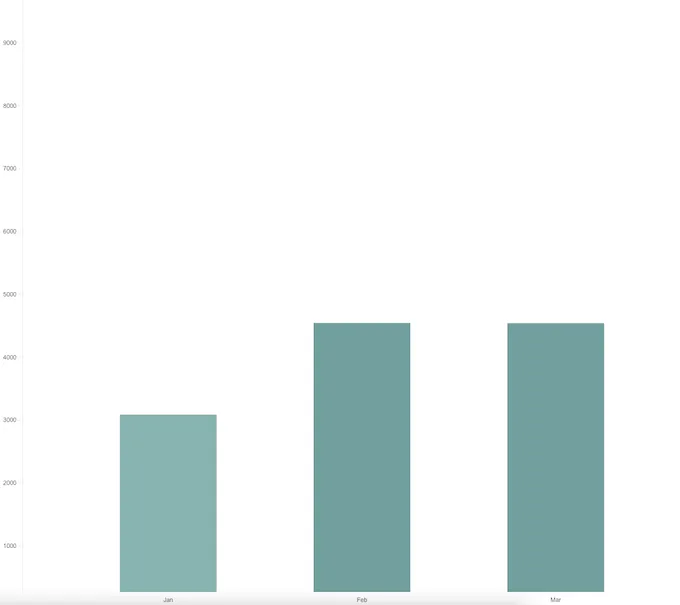
Align
Sets the alignment to the specified number value between 0 and 1, if align
is not specified, it uses 0.5 as a default value.
Control how the outer padding should be distributed, where 0.5 would distribute
the padding equally on both sides
myBandScale: { type: "band", data: ["Jan", "Feb", "Mar"], padding: 0.5, align : 0.75},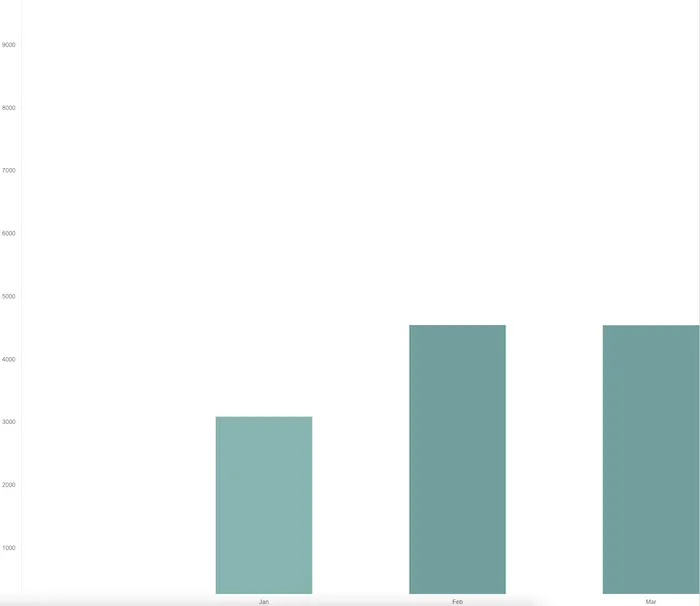
API Reference
For more information, see the API reference.