Point
A component that renders points in a designated area. Typically used to create:
- Scatter plot
- Bubble chart
- Distribution plot
- Heat maps
Data
Add a point component in the components:
components: [ { type: "point", data: { extract: { field: "Year", props: { y: { field: "Sales" }, mar: { field: "Margin" }, }, }, }, },];Within the point component, you first set the type of a component to point
then define a data object where you extract the Year value from the previously
provided data set ( a matrix data set - a 2D-array
containing the fields Year, Month, Sales and Margin) for each row and define
that Sales and Margin which should be mapped to the arbitrary properties
y and mar for each data item.
Scales
Add the scales object:
scales: { s: { data: { field: 'Sales' }, invert: true, expand: 0.1 }, m: { data: { field: 'Margin' }, expand: 0.1 }}Here scales s and m
are defined, which take their data from the fields Sales and Margin respectively.
Both scales can be either linear or ordinal scale. Depending on what kind of
visualization you want to create. If you do not explicitly specify the type of a
scale, it is usually detected automatically based on the meta-information of the
provided field - if the field only contains strings, it is a band scale,
otherwise, a linear scale is created by default.
Visual properties
Define the visual properties for this point component through its settings object:
components: [{ type: 'point', data: {...} settings: { x: { scale: 'm', ref: 'mar' }, y: { scale: 's' }, size: () => Math.random(), opacity: 0.8 },}]There are three ways to define the value for a visual property:
- An object containing a reference to a scale and an extracted data value
For the x position, you use m as a scale and reference the mar property
in the extracted item. In cases when the visual property has the same name
as the data property, there is no need to set an explicit ref, as is the
case with y.
- A function, which is executed once per data item
The size of each bubble is randomized between 0 and 1
- A constant
The opacity for all bubbles is set to 0.8
Most of the numerical properties in picasso.js are relative and defined as a value between 0 and 1, the primary reason for this is to ensure responsiveness as the chart is resized.
Example
components: [ { type: "point", data: { extract: { field: "Area", props: { x: { field: "S" }, y: { field: "City" }, }, }, }, settings: { x: { scale: { data: { field: "S" } }, }, y: { scale: { data: { extract: { field: "City" } } }, }, fill: { scale: { data: { extract: { field: "City" } }, type: "color", }, ref: "y", }, opacity: 0.8, size: () => Math.random(), strokeWidth: 2, stroke: "#fff", }, },];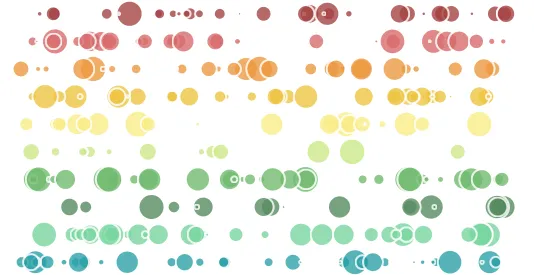
API Reference
For more information, see the API reference.