Line area
The line component draws a line/area through every
data set point.

Get started
Here is a simple code example with the bare-minimun required properties, this example outputs a simple line chart:
{ key: "lines", type: "line", data: { extract: { field: "Year", props: { v: { field: "Sales" }, }, }, }, settings: { coordinates: { major: { scale: "t" }, minor: { scale: "y", ref: "v" }, }, orientation: "horizontal", layers: {}, },}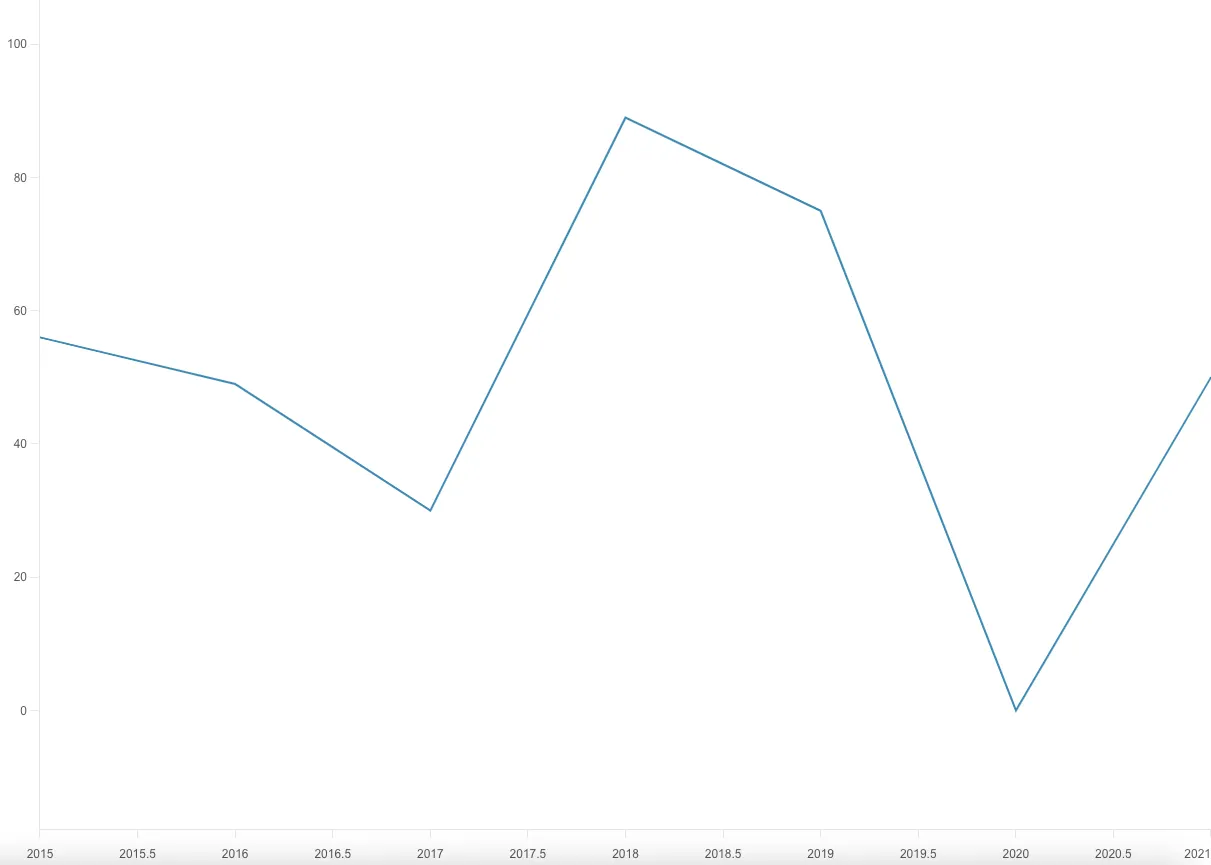
Requirements
Data and Scales are required properties within the chart for the line component to work so take a moment to understand them/ Here is the sample data and scales used in the preceding example:
data: [ { type: "matrix", data: [ ["Year", "Sales"], [2015, 56], [2016, 49], [2017, 30], [2018, 89], [2019, 75], [2020, 0], [2021, 50], ], },],scales: { y: { data: { field: "Sales" }, invert: true, expand: 0.2, }, t: { data: { extract: { field: "Year" } } },},Settings
There are two required properties that are required inside the settings of a line chart:
coordinates:An object containing a reference to a scale and an extracted data value
coordinates: { major: { scale: 't' }, minor: { scale: 'y', ref: 'v' },}layers:This property is used to style and customize the component, seeCommon use casesbelow
Common use cases
Smooth edges
To smooth edges try using the property curve inside the layers settings
layers: { curve: 'monotone',}Fill the area
To fill the area delimited by the line try using the area property inside the
layers settings
area: { fill: "#9bcd25", opacity: () => Math.random(),},Customize the line
To customize the line, try using the line property.
line: { strokeWidth: 4, stroke: "#9bcd25"}API Reference
For more information, see the API reference.