Box
A component that renders boxes. Typically used to create:
- Bar chart
- Box plot
- Candlestick chart
- Gantt chart
How the box component works
This assumes that you have some basic knowledge of how scales and components work in picasso.js. If you don’t, please read the tutorials first.
The box component, in comparison to other components, does not rely entirely on settings. It presumes certain values have been bound to the data and behaves differently depending on what data props are mapped to the component.
To create a full box plot, it requires a “major” and “minor” scale, a field to extract (major), and props (minor) for each field.
For a full-featured visual box plot without interactions, the properties and settings, at a minimum, look something like this:
{ type: 'box', data: { extract: { field: 'products', props: { min: { field: 'lowest sales' }, start: { field: 'low sales' }, med: { field: 'median for sales' }, end: { field: 'high sales' }, max: { field: 'highest sales' } } } }, settings: { major: { scale: 'x' }, minor: { scale: 'y' } }}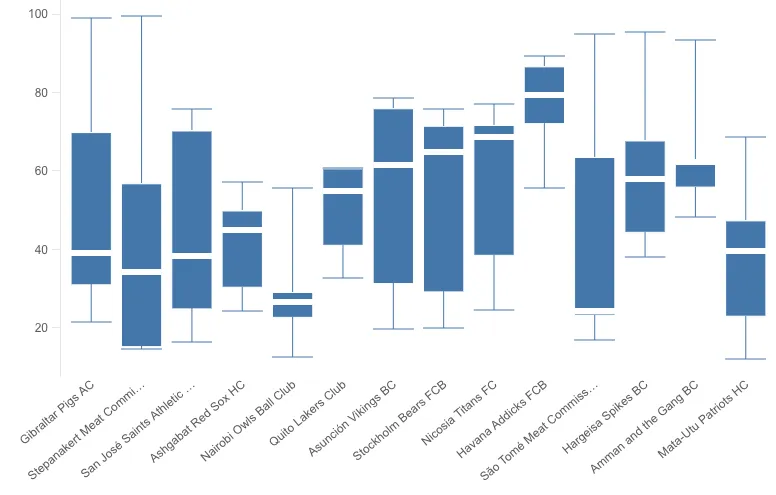
Bar chart example
You don’t need to include all of the props mentioned earlier, if you just specify
start and end, you’ll only get a rectangle between start and end. If you
specify start, end, and med, you’ll only get those, and not the low/high
whiskers, for example.
The props do not need to be mapped to a data source either, they can be static, so to create a bar chart, you just set start to 0:
{ type: 'box', data: { extract: { field: 'products', props: { start: 0, end: { field: 'high sales' } } } }, settings: { major: { scale: 'x' }, minor: { scale: 'y' } }}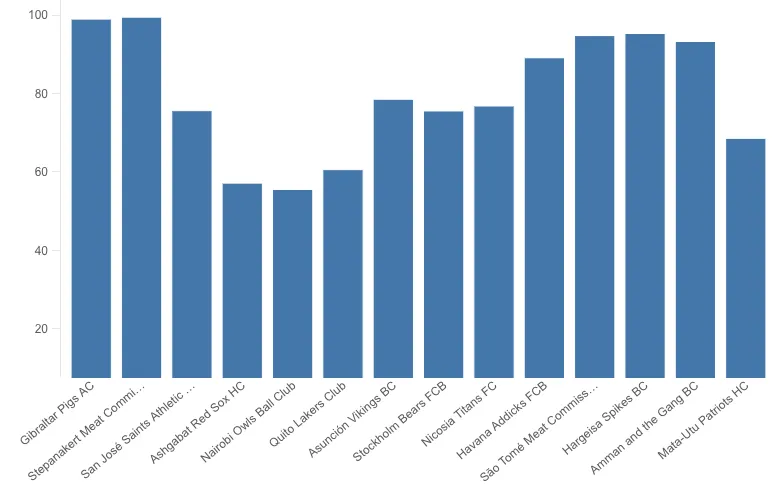
Candlestick chart example
The box presumes ‘start’ values are always lower than ‘end’ values, and the box therefore renders a bit weird if you try to create a candlestick chart with raw ‘Open-High-Low-Close’ values.
You should probably sort the values so the values always are in numerical order, but that doesn’t limit you from creating a candlestick chart.
In this example, open and close is mapped to the data, and can be accessed
these from a function created for the fill of the box.
Example:
{ type: 'box', data: { extract: { field: 'stick', props: { min: { field: 'low' }, start: { field: 'open-close-low' }, open: { field: 'open' }, close: { field: 'close' }, end: { field: 'open-close-high' }, max: { field: 'high' } } } }, settings: { major: { scale: 'x' }, minor: { scale: 'y' }, box: { fill: function(d) { return d.datum.open.value > d.datum.close.value ? 'green' : 'red'; } } }}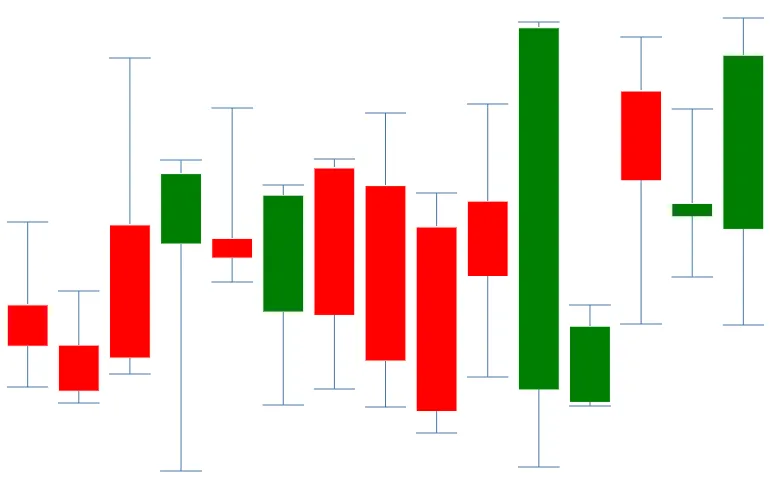
Out of bounds EXPERIMENTAL
Please note - this is an experimental feature and may be subject to change or removal without deprecation
If a box or all of its data is out of bounds, for example outside of the renderable area, the box is not rendered at all, instead, the marker displays an arrow pointing towards where the box is. It’s known as the out-of-bounds arrow.
The Out-Of-Bounds feature can be turned off using:
{ type: 'box', data: { [data props here] }, settings: { major: { scale: 'x' }, minor: { scale: 'y' }, oob: { show: false // turn off out of bounds arrows } }}API Reference
For more information, see the API reference.