Build a simple mashup using capability APIs
For new integrations, use qlik-embed to safeguard against third-party cookie blocking and unlock future features.
This tutorial remains available for those with existing implementations, but upgrading to qlik-embed ensures a robust, forward-looking solution.
To do something similar with qlik-embed, refer to embedding Qlik Analytics using qlik-embed web components.
This guide shows you how to create a simple mashup that connects to Qlik Cloud and visualizes some data.
Prerequisites
Development environment requirements:
- node.js v10.0.0+ installed on your machine.
- A text editor, such as VS Code.
Before you can integrate with Qlik Cloud, you need to perform the following steps:
- Register for a subscription on Qlik Cloud.
- Configure your deployment.
- Create a new web integration
from the Management console.
- You later run the mashup from your local machine. To allow this
connection to happen, you should add
http://127.0.0.1:8080to the whitelist of origins. - Once the web integration has been created, an ID has been assigned to it.
This is the
qlik-web-integration-idyou need later on.
- You later run the mashup from your local machine. To allow this
connection to happen, you should add
- Upload an app. If you don’t have an app or data already prepared, you can download the movies dataset from the GitHub repository and upload it to Qlik Cloud.
Create the container
Create a folder named myMashup to contain your assets.
Create the main script file
Create the main JavaScript file index.js and place it in the myMashup
folder.
To configure the connection, you need the following:
- The Qlik Cloud tenant URL.
- The qlik-web-integration-id.
- the GUID of the app you want to open.
Configure your tenant
The tenant must be configured in your mashup. This is needed for the following reasons:
- To define the actual Qlik associative engine connection, which is used when you
open an app or get a list of apps. This is covered by the
configJavaScript object, used as a parameter in theopenAppcall. - To define where the Qlik Sense client-side software and files should be loaded
from. This is achieved by configuring RequireJS with the
require.configcall and setting thebaseUrl. - To define the web integration ID, which is necessary to enable cross-domain resource sharing.
const config = { host: "your-tenant.us.qlikcloud.com", //for example, 'abc.us.example.com' prefix: "/", port: 443, isSecure: true, webIntegrationId: "web-integration-id-here",};require.config({ baseUrl: `https://${config.host}/resources`, webIntegrationId: config.webIntegrationId,});For OAuth authorization flow use clientId instead.
const config = { host: "your-tenant.us.qlikcloud.com", //for example, 'abc.us.example.com' prefix: "/", port: 443, isSecure: true, webIntegrationId: "web-integration-id-here", clientId: "OAuthClientId",};require.config({ baseUrl: `https://${config.host}/resources`, webIntegrationId: config.webIntegrationId, clientId: config.clientId,});Set the global require and error handling
The JavaScript file is loaded in the browser when your mashup is used. RequireJS is used as a module loader.
require(["js/qlik"], (qlik) => { qlik.on("error", (error) => console.error(error));});Don’t use different versions of RequireJS on the same web page. You can find out which version of RequireJS is being used by typing require.version in the browser console while viewing the mashup in the browser.
Connect to the Qlik Sense app
Connect to the Qlik Sense app containing the objects you want to display on your web page. If you’re unsure of which IDs to use, review find IDs for embedding.
const app = qlik.openApp("AppId", config); // Replace 'AppId' with the movies app IDAdd this code within the scope of the require() method.
Retrieve the Qlik Sense objects
Fetch the objects you want to display.
app.visualization.get("ObjectId").then((vis) => vis.show("QV01"));Add this code within the scope of the require() method.
Create the main HTML file
Create an HTML file and name it index.html. Save the file in the myMashup
folder.
Define the relationships
The relationship between the current document and the linked Qlik Sense defined
style sheet is specified in a <link/> rel tag inside the <head/> of the
HTML file.
<link rel="stylesheet" href="https://your-tenant.us.qlikcloud.com/resources/autogenerated/qlik-styles.css"/><script src="https://your-tenant.us.qlikcloud.com/resources/assets/external/requirejs/require.js"></script><script src="index.js"></script>Add an internal style sheet tag
Add some internal styling inside the head of the HTML file to organize the presentation of the charts.
<style> div.flex-container { display: flex; flex-wrap: wrap; margin: 0 45px 45px 0; } div.qvobject { flex: 1 1 auto; height: 300px; min-width: 400px; margin: 45px 0 0 45px; }</style>Place the Qlik Sense objects
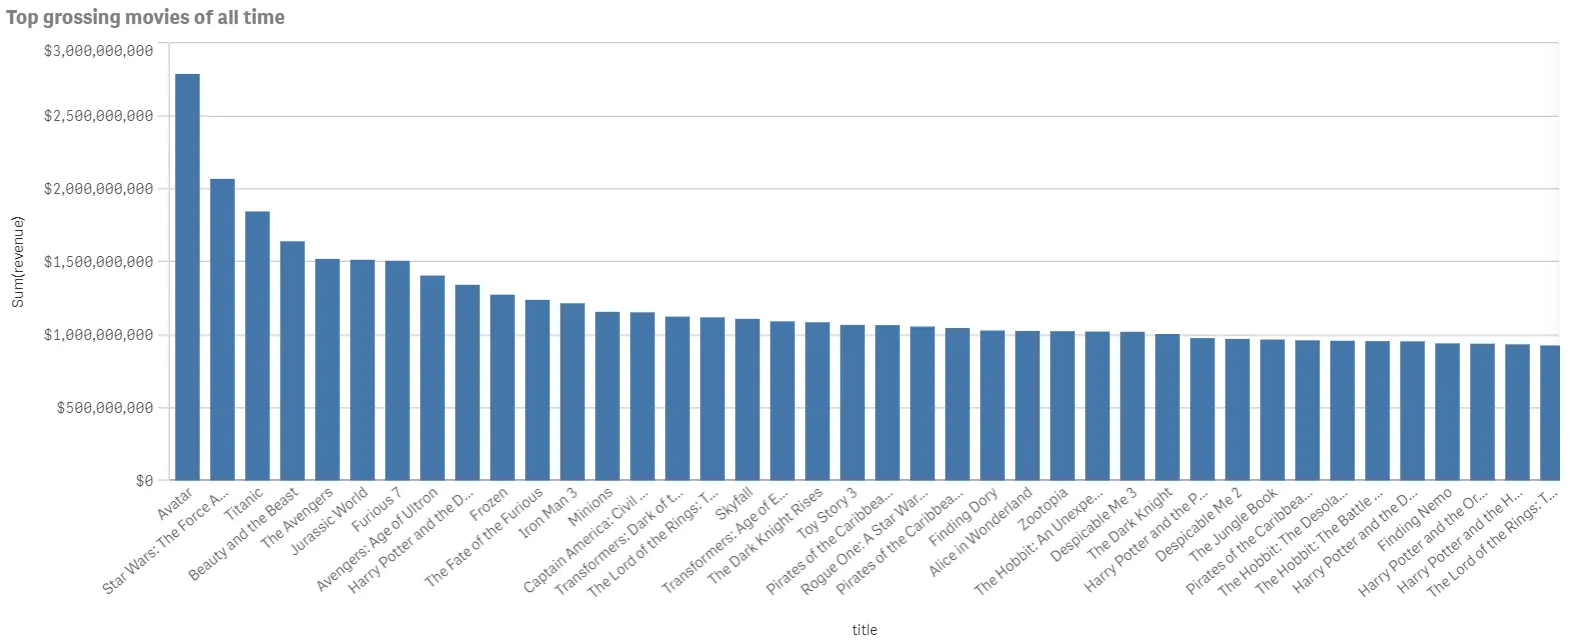
The movies dataset you uploaded earlier has a bar chart on the first sheet with
the ID EAjjuyE. You can render that same bar chart in your mashup by providing
the ID and an element into which you can render the visualization.
Qlik Sense objects that have been defined in the JavaScript file are placed
inside div tags inside the body of the HTML file.
<div class="flex-container"> <div id="QV01" class="qvobject"></div></div>Set up a web server
To serve your mashup locally, you’ll need an HTTP web server.
-
Navigate to the
myMashupfolder. -
Open a command line window on your local machine and run:
Terminal window npx live-serverYou should see the following message:
Terminal window Serving ..."myMashup" at http://127.0.0.1:8080Ready for changes
Test the mashup
-
Log into the tenant.
-
Open a browser to access the mashup. Enter the following URL:
Terminal window http://127.0.0.1:8080
You should see the movies dataset visualized in a bar chart.
The visualization is fully interactive, any selections you make are reflected in the current app selections toolbar at the top.